Some reports also have a “CrossTab” option, along with the default table format for
displaying report data. These reports are:
Product Usage by Month Report
Discovered Product Use by Month Report
For example, in the 'Product Usage by Month' report under the 'Assets' menu, there is
a toggling filter called View Table or CrossTab .
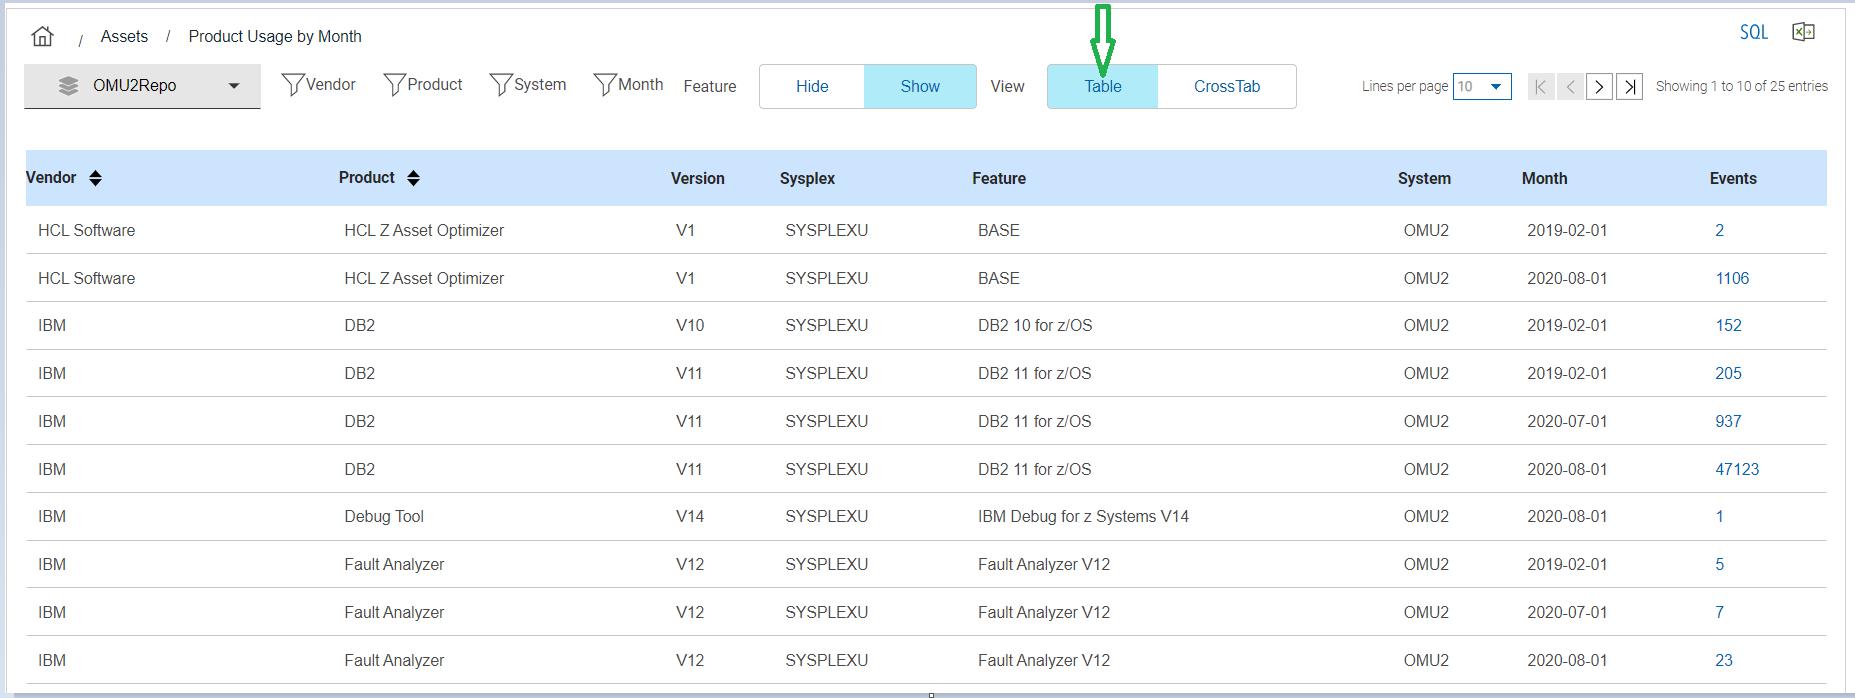
By clicking on the Table button, the report is displayed in standard column
output format and the highlighted button text changes to “Table”, as shown.
Crosstab output is the default display for this report. Figure 1. Product Usage by Month Table Format
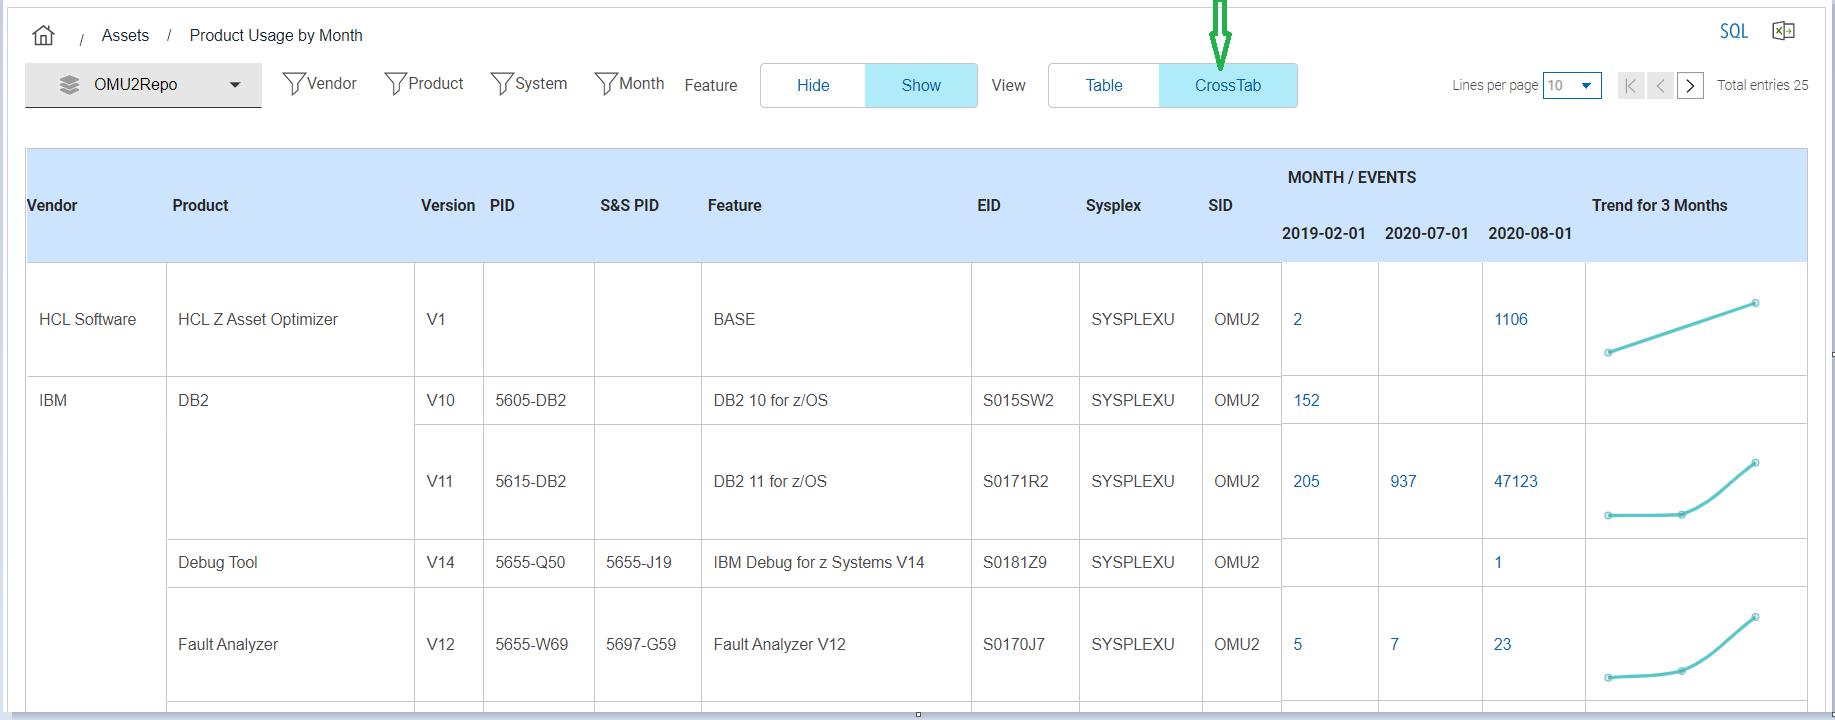
You can switch back to the “Crosstab” display by clicking on the CrossTab
button. Figure 2. Product Usage by Month CrossTab format
No trend graph will be plotted if there isonly a single data point (events data for a single
period) available.