Workload Dashboard
monitor your environment using the Workload Dashboard
You can monitor the progress of your plan by using a dashboard.
To open the Workload Dashboard, in the navigation bar at the top, click . The panel opens showing a number of predefined widgets which return the results for the most widely-used queries. The Workload Dashboard provides a single, consolidated view for monitoring the workload status. By selecting the engine on the list, you can see the information related to the engine.
To customize the Workload Dashboard duplicate it by clicking the hamburger menu at the top left of the panel.
To create you own dashboard, refer to Creating a customized dashboard for monitoring.
Workload Dashboard
In the Workload Dashboard you can view the whole status of your workload at a glance for one or more of the engines you have configured. You can check the status of workstations, jobs, critical jobs, prompts, and other relevant information.
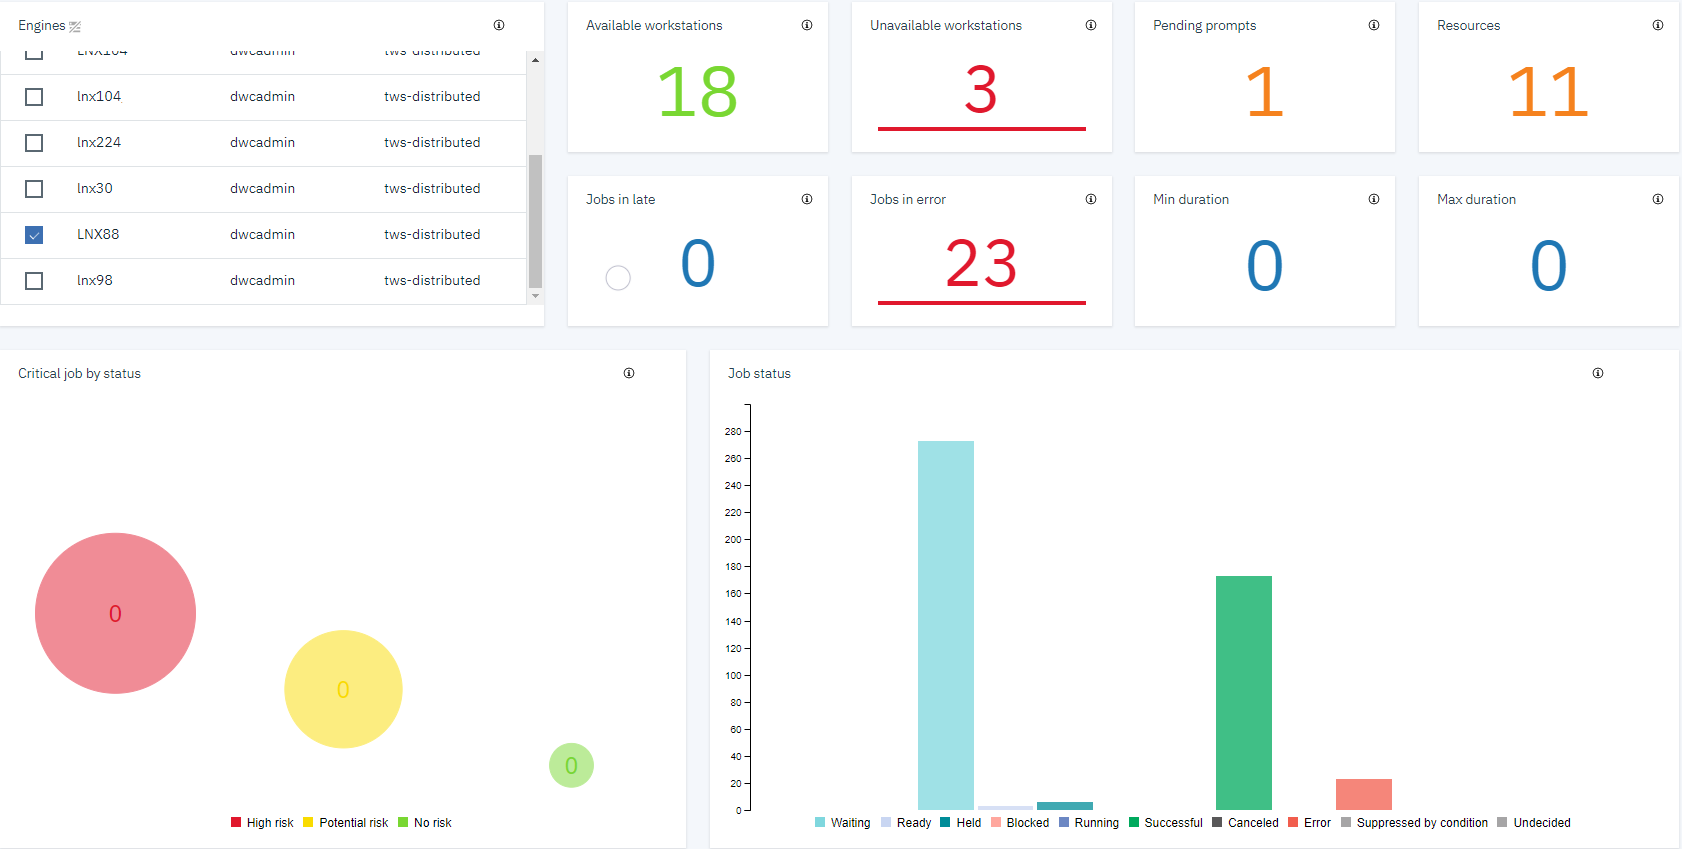
- Engines
- This table lists the available engines. By selecting the engine you can see the details in each widget.
- Available workstations
- This widget shows the number of available workstations for the selected engine. By clicking on the widget the Monitor Workstations view is displayed with detailed information about available workstations.
- Unavailable workstations
- This widget shows the number of unavailable workstations for the selected engine. By double clicking on the widget the Monitor Workstations view is displayed with detailed information about unavailable workstations.
 Pending Prompts
- This panel shows prompts for the selected engine. By clicking on the widget the Monitor Prompts view is displayed.
- Critical job status
- This widget shows in a bar chart the number of jobs in high, potential, and no risk status for the selected engine. By clicking on the widget the Monitor Jobs view is displayed with detailed information about jobs in critical status.
- Job status
- This pane shows the status of the jobs. By clicking on the widget the Monitor Jobs view is displayed with detailed information
- Jobs in late
- This widget shows how many jobs have completed in late status for the selected engine. By clicking on the widget the Monitor Jobs view is displayed with detailed information about jobs in late status.
- Jobs in error
- This widget shows how many jobs have completed in error status for the selected engine. By clicking on the widget the Monitor Jobs view is displayed with detailed information about jobs in error status.
- Min duration
- This widget shows the number of jobs that have not reached the minimum duration for the selected engine. By clicking on the widget the Monitor Jobs view is displayed with detailed information about jobs that have not reached the minimum duration.
- Max duration
- This widget shows the number of jobs that have exceeded the maximum duration for the selected engine. By clicking on the widget the Monitor Jobs view is displayed with detailed information about jobs that have exceeded the maximum duration.
- Resources
- This widget shows the status of your resources. By clicking on the widget the Monitor Resources view is displayed with detailed information about the resources.