Generating the Project Performance Crosstab report
The Project Performance Crosstab report shows high-level project metrics in a cross tabulation along multiple dimensions of custom attributes.
About this task
Procedure
- Select .
-
In the list of reports, click Project Performance Crosstab.
A screen appears, which allows you to set filter criteria.
-
On the first filter page, choose the projects to include in the report.
To specify other filters, click Additional Prompts and proceed to step 4. Otherwise, skip to step 5.
- Optional:
On the second filter page, specify any of the following filters:
- Project owner
- Project date range
- Project status
- Project type: determined based on the template that was used to create the project
All sections on the filter pages are optional. If you do not enter any information in any of the sections, the resulting report contains the resource task load for all users and all projects in the system.
- Click Finish to create the report.
Example
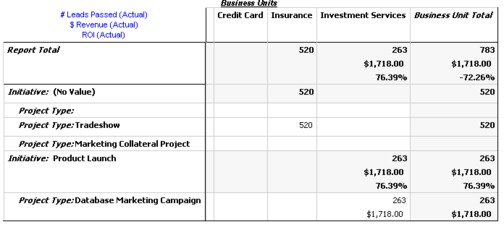
The sample report is a cross tab of project performance metrics including leads passed, revenue, and ROI (Return on Investment), aggregated over initiative and project type for business units. The sample report contains the following information:
- Row Dimensions: (1) Initiative, (2) Project Type
Data in the rows is grouped by Initiative. You can use this field to categorize your programs and plans. Each Initiative section contains rows for each Project Type included in the report.
Project type is determined from the template that was used for creating the project. Sample project types are Database Marketing Campaign, Tradeshow Template, Marketing Collateral, and Campaign Project Template.
- Column Dimension: Business Unit
A business unit is a field on the project and plan creation page. It is one way to categorize projects and plans.
- Metrics to show: number of leads passed, revenue, and ROI (Return on Investment)
Example of a Project Performance Crosstab report:
