Previewing field values from your user data
When you configure a process in a flowchart, you can use the Profile feature to preview field values. This feature lets you see actual values from fields in your user data. You can profile any field in a mapped data source. You can also profile derived fields.
Before you begin
About this task
When you profile a field, you can view and select values to use in the current operation, for example to build a query for a Select process.
In addition to listing the values, the Profile feature indicates each value's frequency of occurrence in the selected field. You can use this information to ensure that you are targeting the intended contacts. Only records in the current cell are included in the count, unless the counts were pre-computed.
Procedure
- Click Profile.
Campaign profiles the data in the selected field. The Category and frequency Count fields are updated as profiling progresses.
Wait until profiling is complete before using the results, to ensure that all categories are processed and counts are complete.
Results
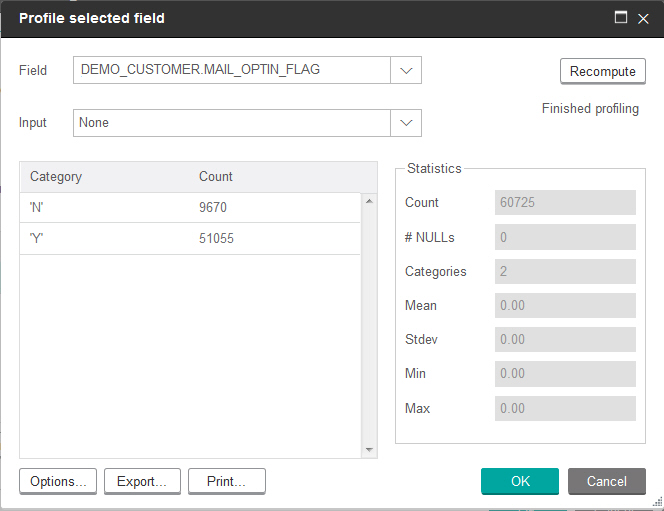
When profiling is complete, the Profile selected field dialog shows the following information:
- The list of values in the selected field, shown in the Category column, and the corresponding Count of IDs with that value. Campaign organizes values by category, grouping them to create approximately equal-sized segments. The default maximum number of categories (distinct bins of values) for display is 25. You can change the maximum number of categories.
- The Statistics pane shows the total count of IDs and other details about
the data for that field, including:
- The number of NULL values found.
- The total number of categories, or values, for that field.
- Statistical values for the data including the mean, standard deviation, minimum, and maximum
values.Note: Mean, Stdev, Min, and Max are not available for ASCII fields. When you profile text fields, these values appear as all zeros.