Use the debug tool to set up traces and gather information
as requested by IBM® Support.
Traces that contain debug messages that help IBM Support solve IBM Sametime® problems.
About this task
The trace types in the debug tool are a subset of values
in the sametime.ini file. The available trace
types vary depending on the number of servers you are working with.
If you want to work with a trace type that is not supported by the
debug tool, set it up manually in the sametime.ini file. Using
this tool to set traces, instead of using the
sametime.ini settings,
provides the following advantages:
- Set up and run traces without restarting the server.
- Set up and run a single trace on multiple servers simultaneously.
Procedure
- Make sure that your workstation is listed as a trusted
IP address on the Community Server where you run the debug tool:
- Log in to the Community Server where you run the debug tool as the system administrator (Windows™) or root user (AIX® or Linux™).
- Open the sametime.ini file, locate the
[DEBUG] section,
and add your workstation's IP address to the DEBUG_TOOL_TRUSTED_IPS setting. For
example:
DEBUG_TOOL_TRUSTED_IPS=9.148.58.4,9.148.58.245,9.148.61.99,9.148.58.202
- Save and close the file.
- Restart the Community Server so your change can take effect.
- Open a browser and navigate to the following URL to access
the service.
http://Community_Server_host_name/servlet/STRunTimeDebugTool?mainPage=1
Where
Community_Server_host_name is
the fully qualified host name of the Community Server where you want
to run the debug tool (the server you used in Step 1).
- Choose the clusters or servers for which you want to set
up a trace.
- If you are using stand-alone Sametime Community Mux servers,
they are listed here.
- If you want to trace Mux services, select only one Community Server.
All Mux services connect to all Community Servers, so selecting multiple
Community Servers or clusters results in duplicated trace information.
- If some servers or clusters are not available, you can either
continue working with the servers or clusters you can access, or cancel
the session.
- Click one of the following options.
| Option | Description |
|---|
| Manage specific traces |
Use this option to set up traces. |
| View Server Traces Status |
This option displays only if you selected a single server.
Use this option to view traces that are already set up. |
- If you clicked View Server Traces Status,
no further action is necessary. If you clicked Manage specific
traces and services, continue to Step 6.
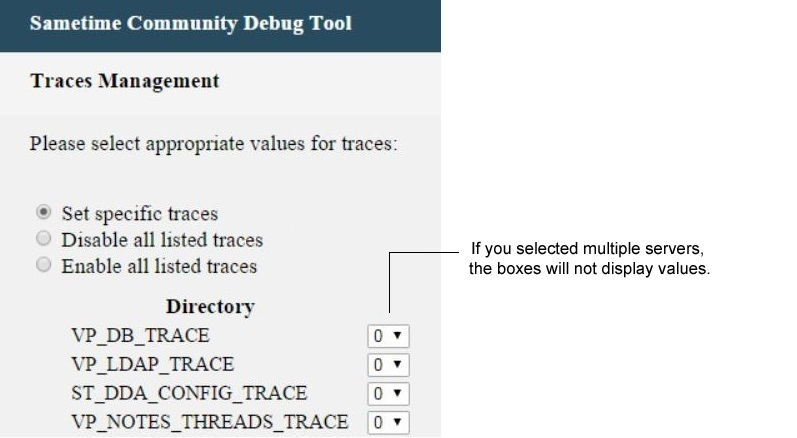
- In the Available Services window,
select the services for which you want to set traces.
The
list represents services on a single server, which is randomly chosen
from the servers you selected in Step 3. The list might not include
services from other servers.
- Select the value for each service.
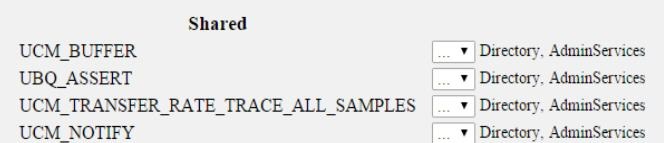
If you selected multiple servers in Step 3, the Shared
section lists the services that the servers have in common.
- Click Submit to start tracing server
connections.
Results
Typically, IBM Support
requires information to be gathered over a number of days. Allow the
tool to run for the amount of time that is requested by IBM Support. At the end of the duration, send
the log file that the tool creates to IBM Support
for further examination.