Total Issues
The Total Issues graph adds the number of relevant issues for each computer and then groups them by their severity rating.
An issue is a Fixlet message that is relevant on any computer in your network. For example, if you have a computer with five relevant Fixlet messages and a second computer with three relevant Fixlet messages, the total number of issues is eight, even if some of those messages are the same.
This graph can be set to different time granularities by selecting from the pull-down menu above the graph. The Auto-Fit Data option automatically groups the data in the graph for up to the last 12 months of your BigFix installation. Last 7 Days groups the data by day and shows the last seven days. Last 30 Days groups the data by day and shows the last 30 days. Last 26 Weeks groups the data by week and shows the last six months. Last 52 Weeks also groups the data by week and shows the last year.
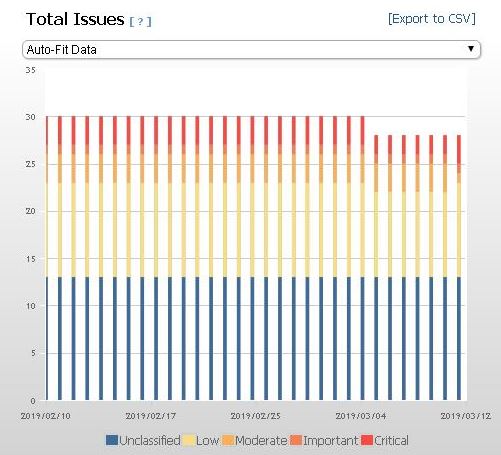
Different colored bars represent different issue severity. The height of each bar represents the number of issues for a particular bar. For example, if a bar for important issues starts at 300 and ends at 500, the total number of important issues is 200. Move your cursor over any point in the graph to see a pop-up containing more detail.