BigFix DEX dashboard features
This section provides information about the BigFix DEX dashboard that is visible to the users.
DEX dashboard is the default homepage for the authenticated users.
- DEX score for the organization based on various dimensions. Pre-configured KPIs across various dimensions depict the organizational DEX score.
- Data based on the selected time frame. DEX score and its sub-scores will be calculated once a day at 00:00 UTC. DEX score calculation happens at the leaf metric. The score is then clubbed for the compound metric. Threshold limits for Tolerating and Frustrating levels are configured at the leaf matrices level.
The Digital Experience score is used to showcase the overall user experience based on the performance of devices and applications.
The following graphs are available:
- Digital Experience Dashboard - Shows overall DEX scores and reports.
- Boot and Login Dashboards - Shows logon and boot analysis reports for devices.
- Device Reliability Dashboard - Shows report related to the errors for devices.
Within the DEX system, Dashboards provide a centralized user interface for data exploration. This interface enables users to monitor key metrics, generate customized reports, and conduct in-depth analysis across data sets from various domains and environments. These dashboards function as a centralized hub, providing a user-friendly interface for comprehensive data exploration.
DEX offers a range of dashboards including Overall Experience, Device-Specific, Productivity Application, and Business Application, providing granular insights into different aspects of the digital experience. By leveraging these dashboards, users can gain valuable data-driven insights to optimize user infrastructure, address bottlenecks, and ultimately create a seamless and productive work environment for user employees.
This dashboard provides a comprehensive view of key performance indicators (KPIs) across the entire organization. It allows users to monitor overall health, identify trends, and make data-driven decisions.
Reports displayed within the Global Dashboard present data dynamically, reflecting the latest information. To ensure data ownership and accuracy, only the user who creates the initial global view (typically an administrator) can modify the reports it contains.
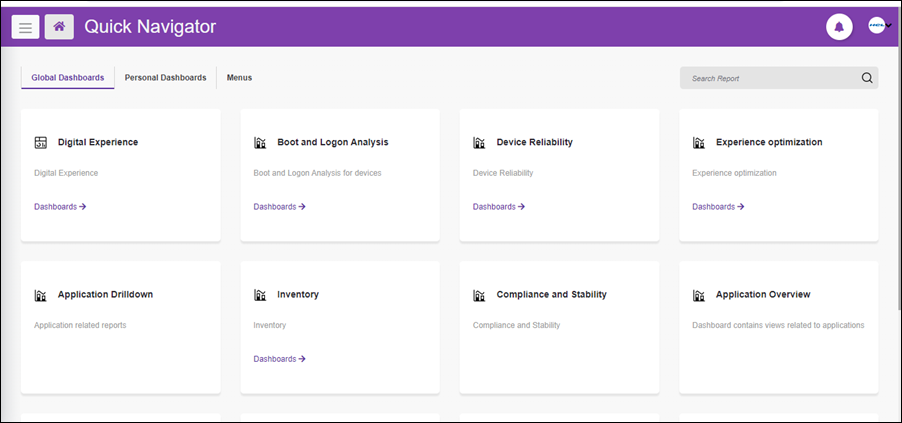
All dashboard users have access to the following dashboards:
- Digital Experience
- Boot and Logon Analysis
- Device Reliability
- Experience Optimization
- Application Drilldown
- Inventory
- Compliance and Stability
- Application Overview
All dashboard users have access to the following dashboards:
- Digital Experience
- Boot and Logon Analysis
- Device Reliability
- Experience Optimization
- Application Drilldown
- Inventory
- Compliance and Stability
- Application Overview