Lab Exercise 1 – Configuration of Runbook Parameters
In this lab exercise, users will learn how to configure the widgets available in the BigFix Runbook AI dashboard and how to consume them. The exercise includes steps for configuring reports, selecting time frames, saving widgets, viewing drill-down details, resizing widgets, moving widgets, and accessing menu options.
Scenario
An organization has been using BigFix Runbook AI for some time now. They are interested in knowing how the product has been performing and other metrics like –
Percentage of automated executions,
Top used runbooks,
Percentage of Successful executions, and many more.
In this lab, we will showcase the detailed procedure for configuring the widgets available in the dashboard and how end users can consume the same.
Prerequisites
User should have the requisite role (Super Admin / Organizational Admin), privileges and access credentials.
Solution
- Open BigFix Runbook AI Web URL and login with organization Admin credentials.
- Go to Reports and click Dashboard.
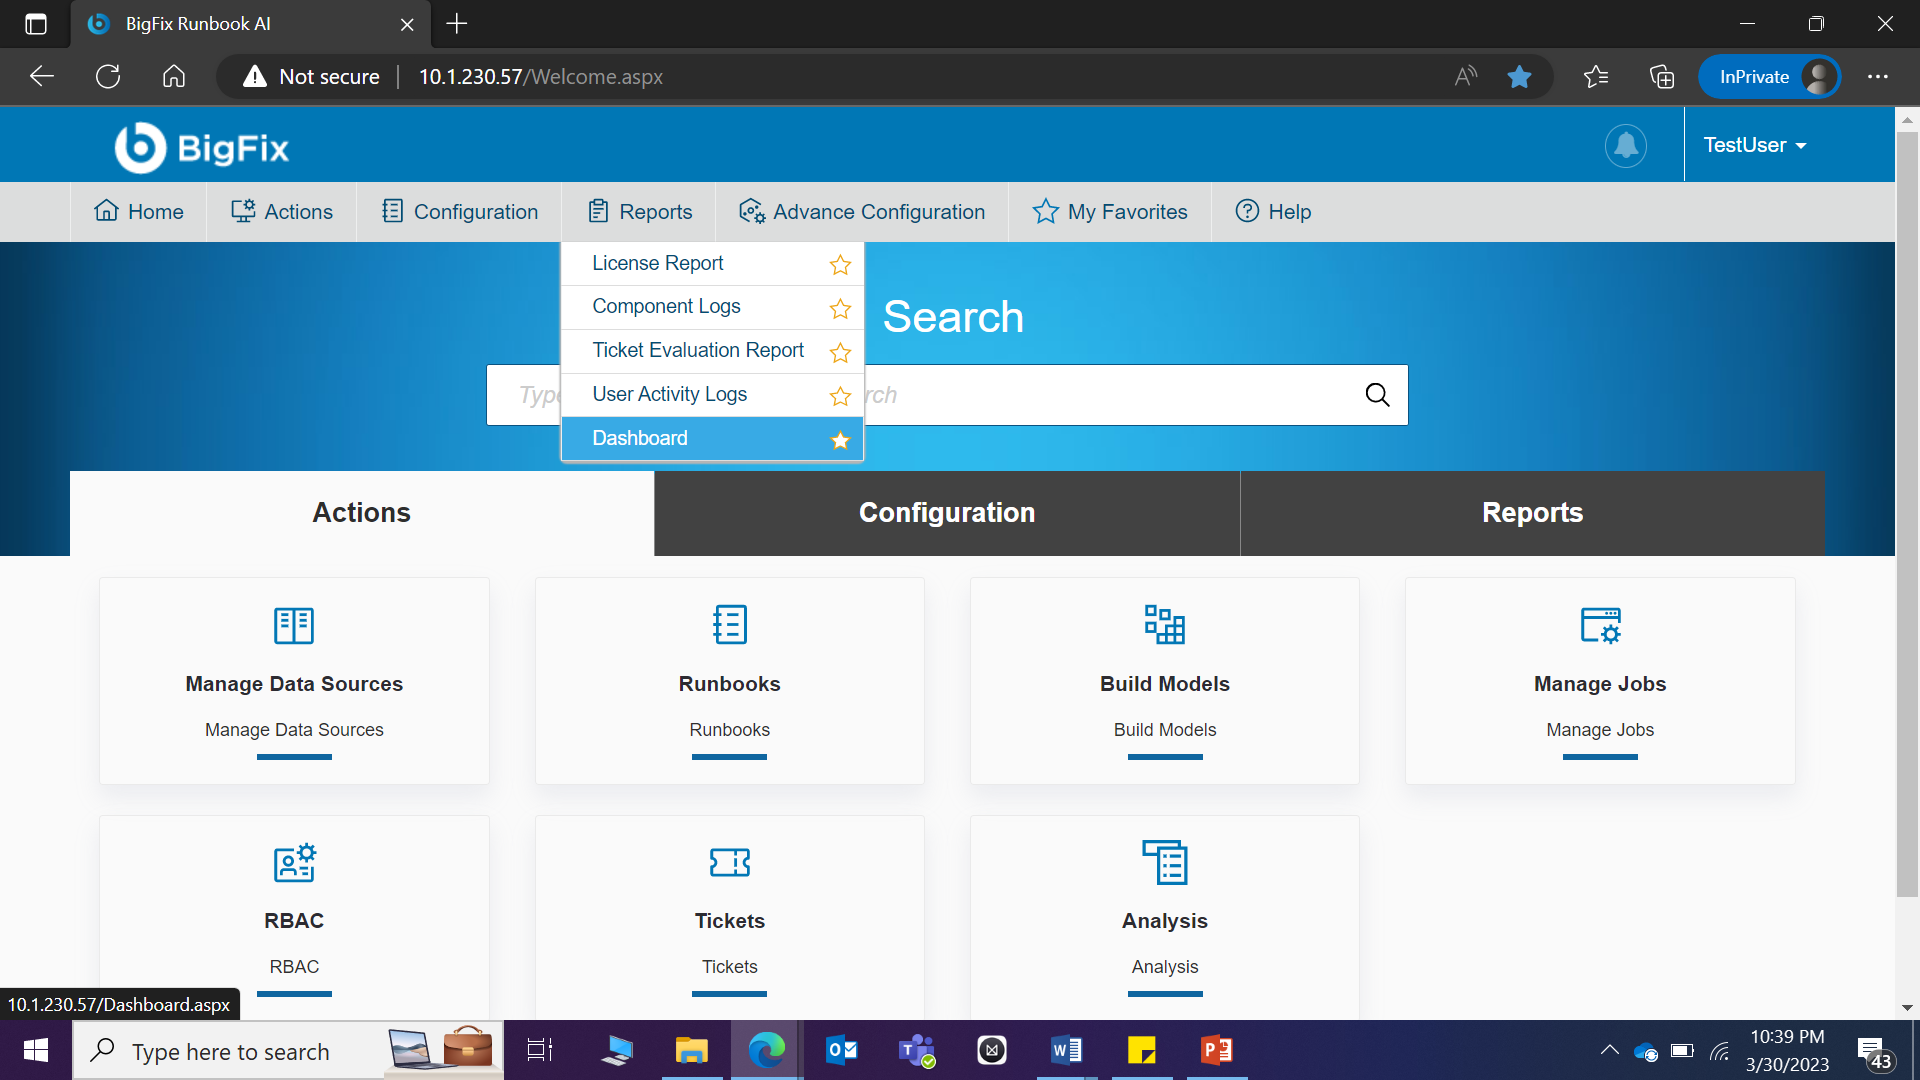
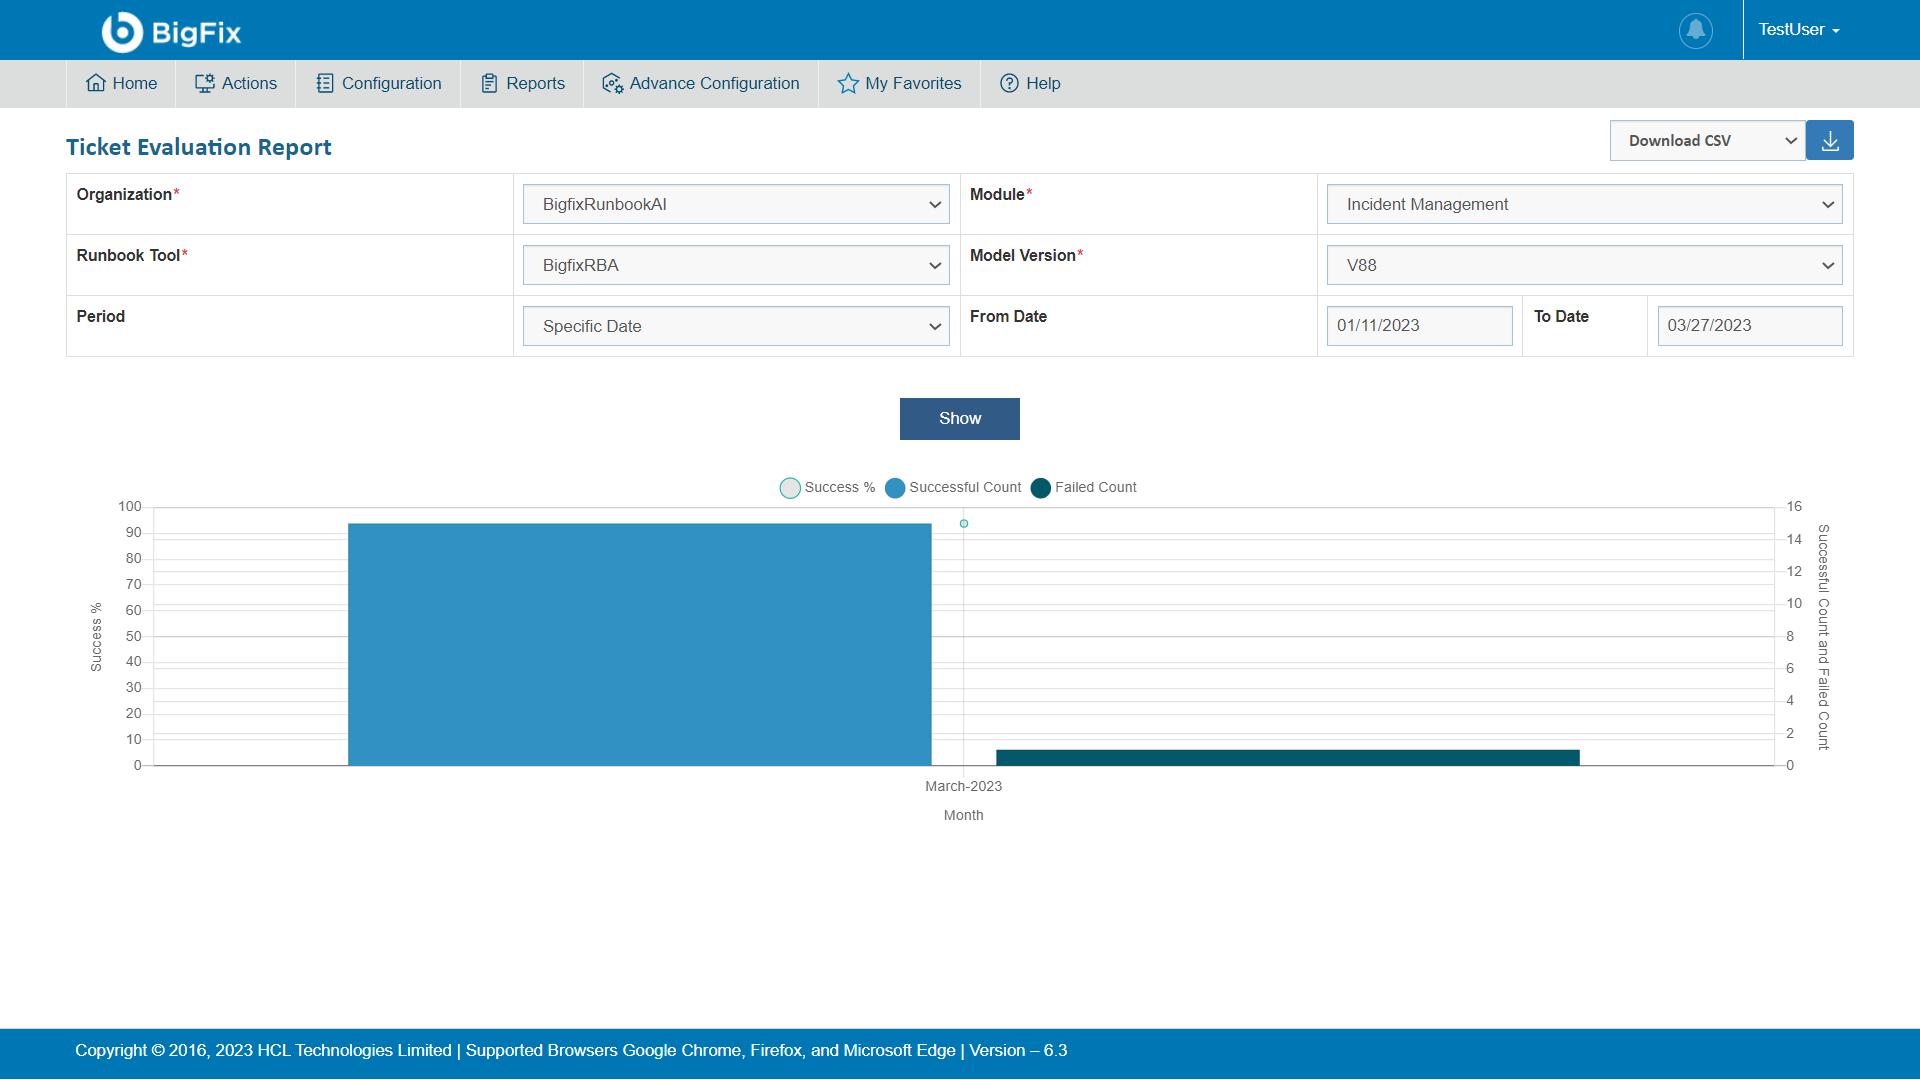
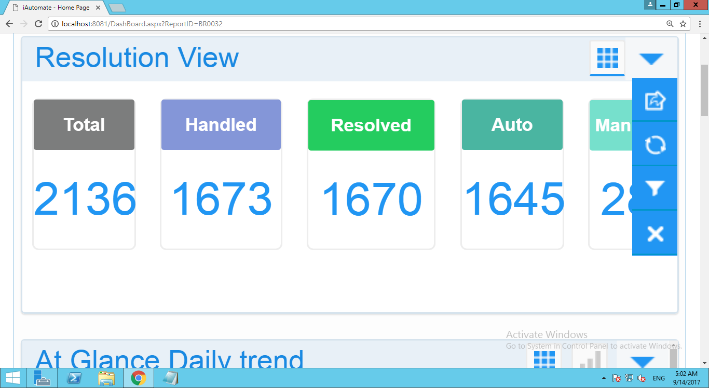
- The Dashboard appears.
Figure 2. Figure 331 – Dashboard View 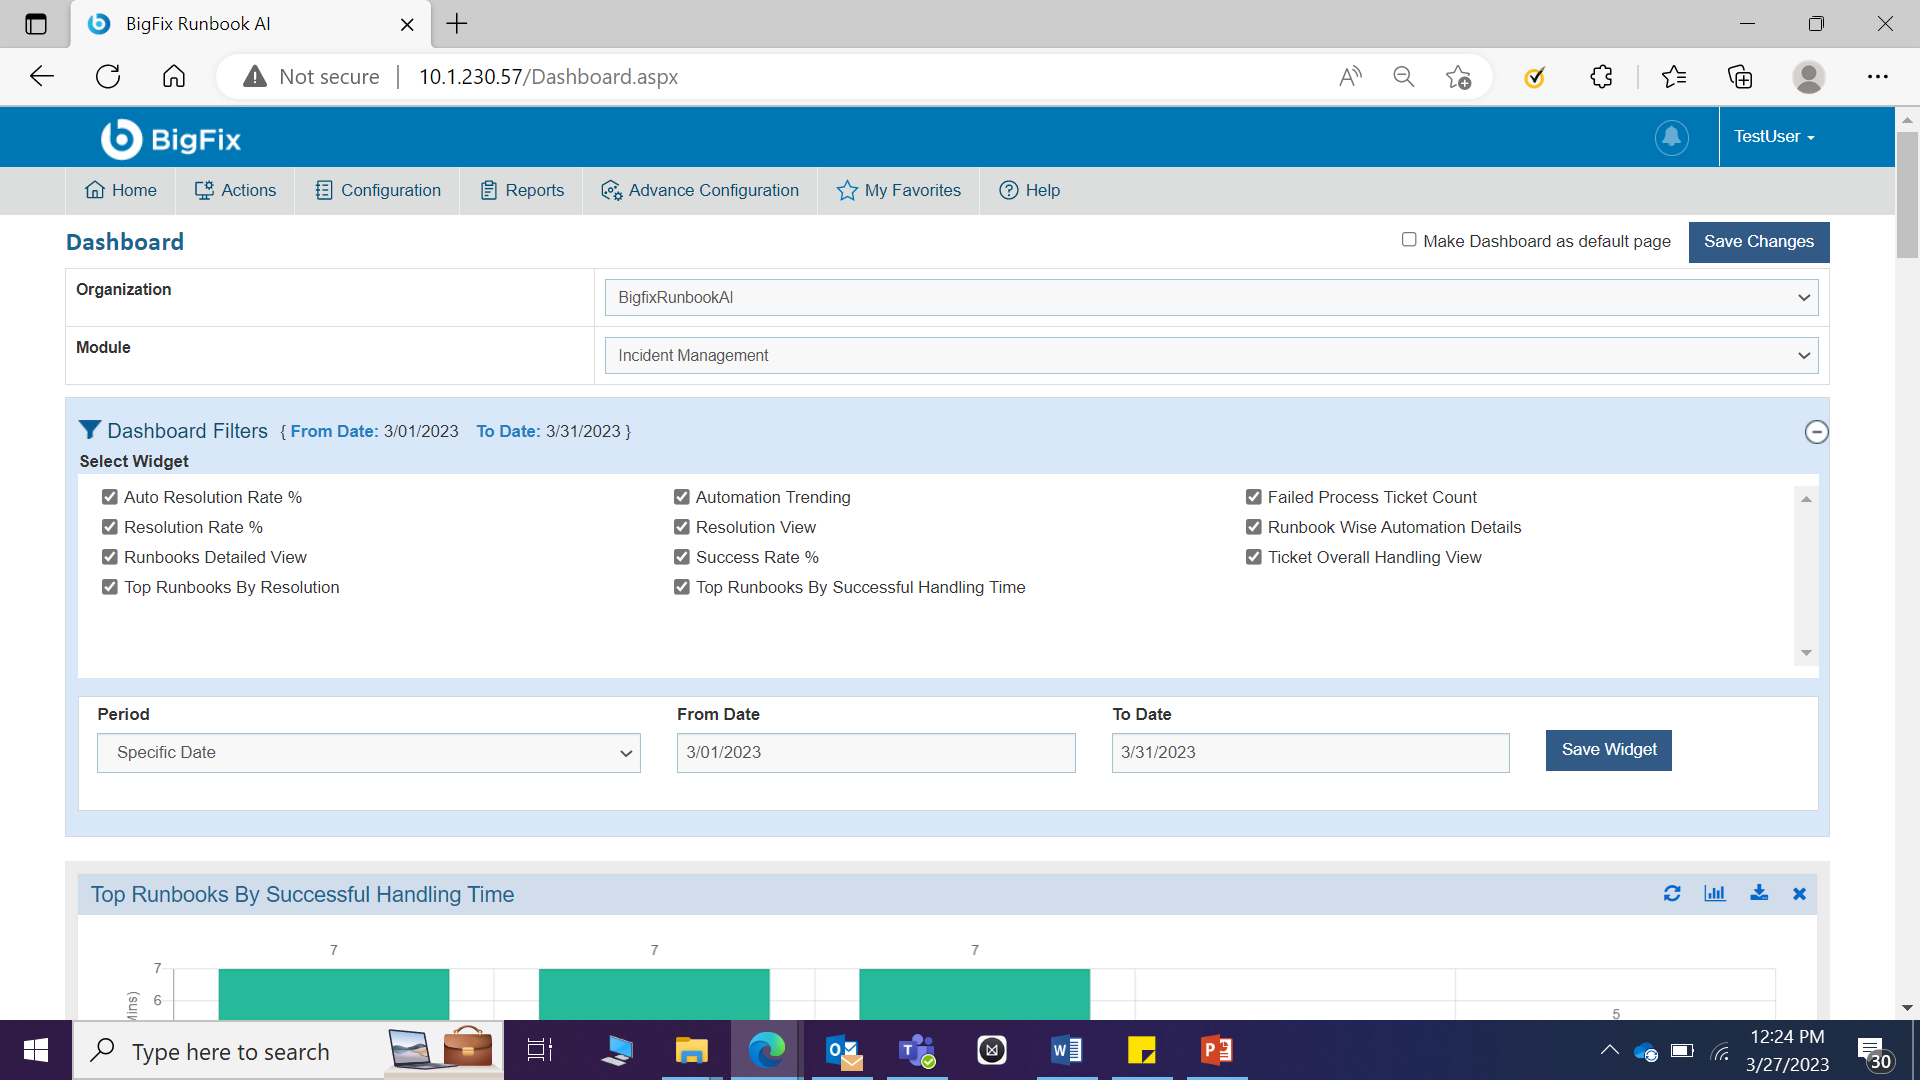
- The Dashboard Filters allow users to narrow the range of one or more reports on the active Dashboard tab. This filter lets you select a specific time frame, such as last month, current month, last quarter, or a range of dates.
- To configure a specific report, select the Organization from the drop-down list, then select the time frame from the drop-down list of the Period, and then select the date range in the From Date and To Date fields. For this exercise select current month.
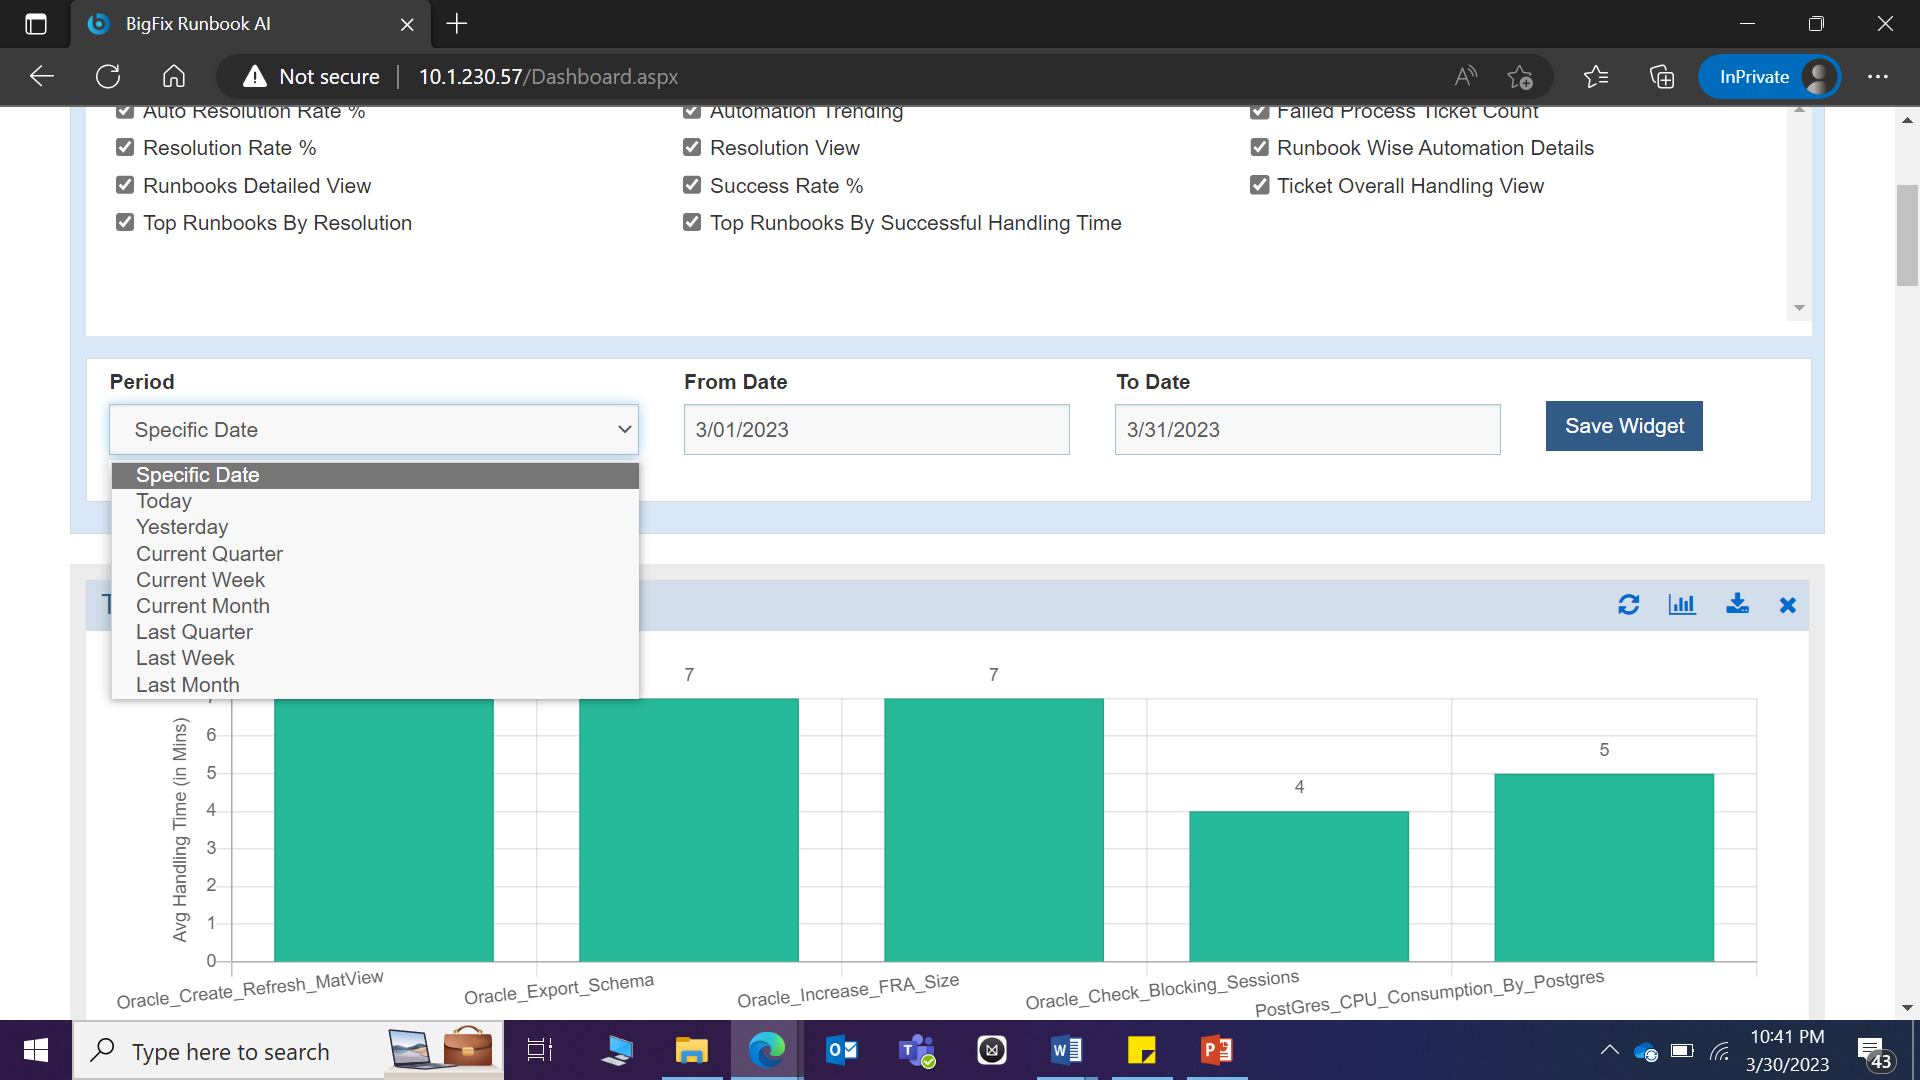
- Select Widget from provided the List. Click Save Widget. These selections will recompile the data that appears in any report that is associated with the date filter. All data beyond the selected range is excluded.
- You can use predefined widgets under Dashboard Filters tab to add new widgets and modify or remove existing widgets from the organization.
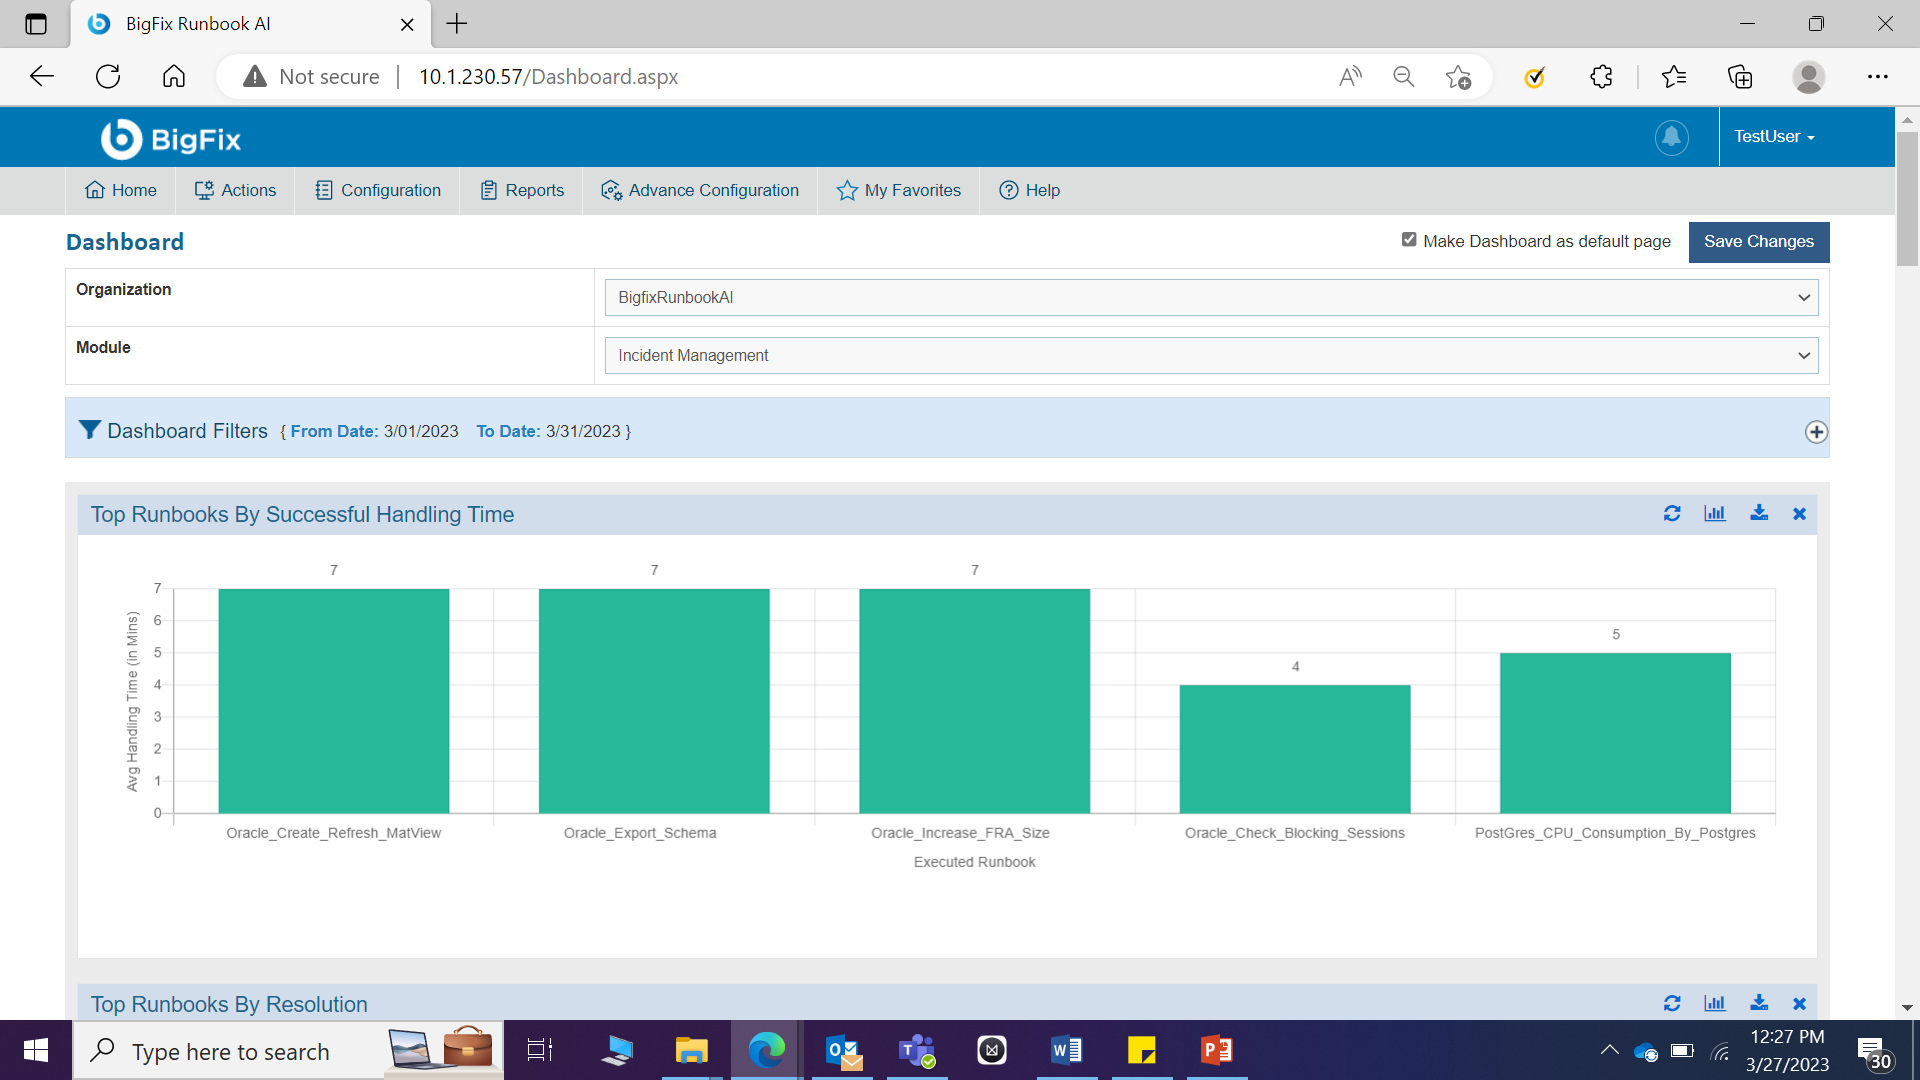
- You can view drill-down details of any report appearing on the widget. To the drill-down report, perform the following steps –
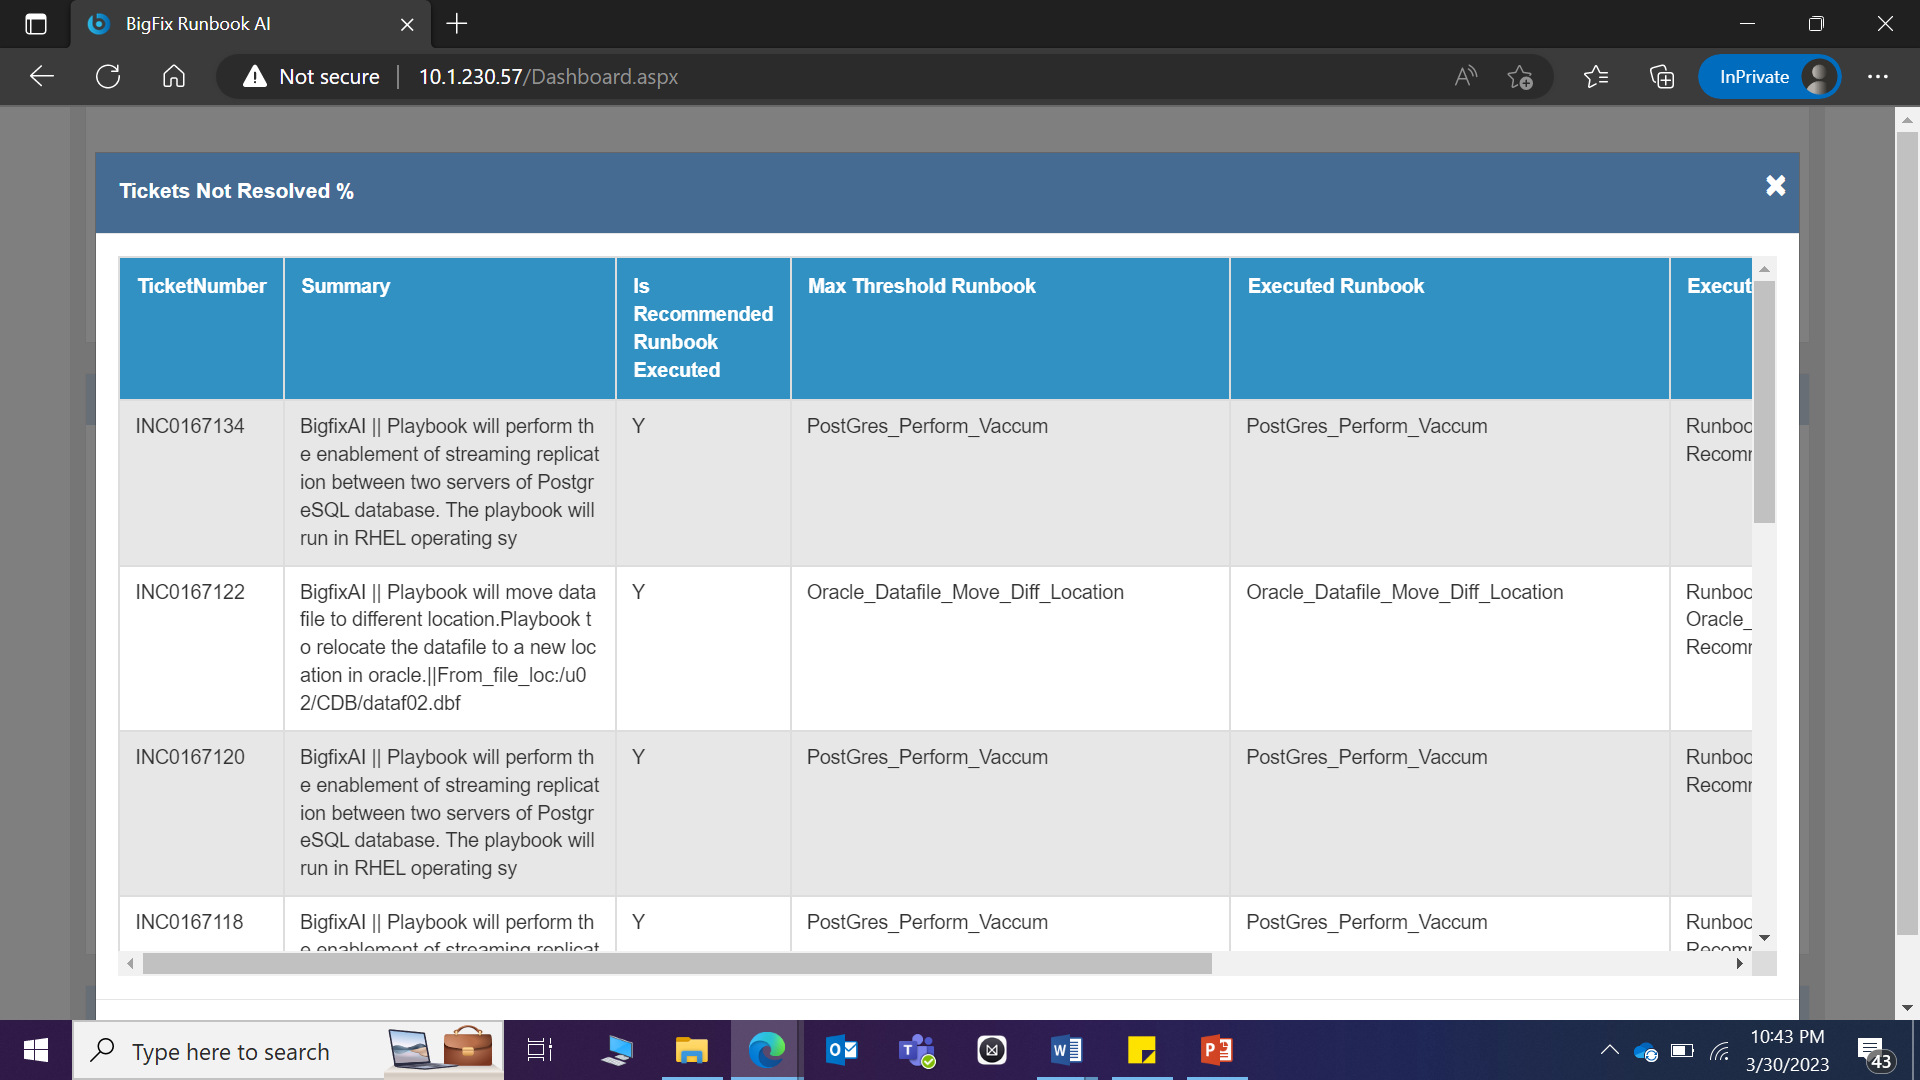
- Click any visualization to view the drill-down report.
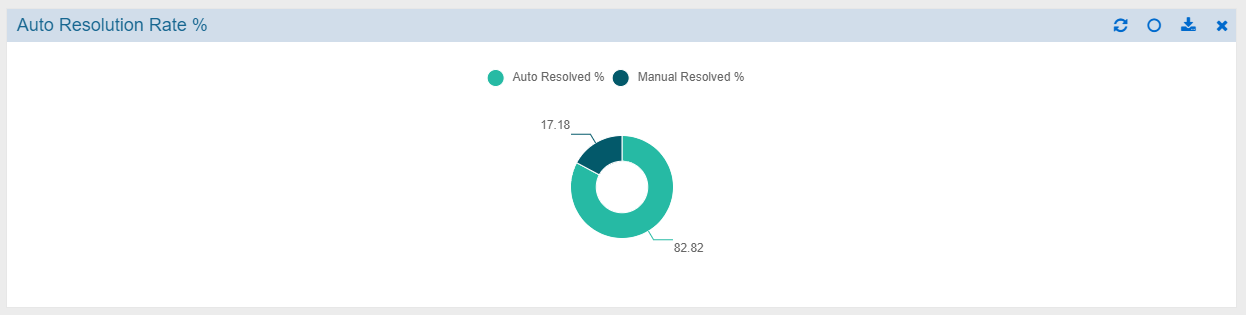
- The detailed drill down report is displayed.
- To resize any widget, perform the following steps –
- Point at any corner of the selected tab with the mouse pointer. When the pointer changes into a double-headed arrow, hold down the primary mouse button and drag the corner in or out to resize the window. Release the mouse button to stop resizing the window.
- Click Save Changes to save the changes
- To move the widget or change the location of the widget based on your preference, perform the following steps –
- Click a blank portion on the navigation bar of the selected tab.
- Hold down the primary mouse button and then drag the mouse pointer to the place on the screen where you want the tab. After you move the mouse pointer to the position on your screen where you want the taskbar, release the mouse button.
- Click Save Changes to save the changes.
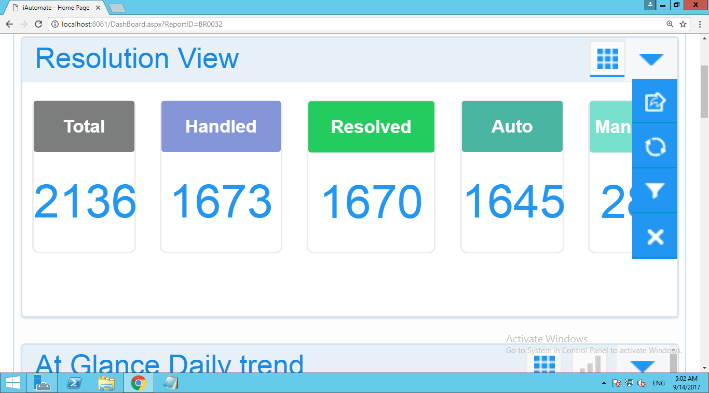
- The navigation bar on each widget contains the following menu options:
| Tabs | Name and Function |
|---|---|
 / /  / /  / / 
|
Change the view of widget to bar/grid/pie/doughnut. |
|
Refresh the data in a widget. |
|
Remove a widget from the selected organization’s dashboard. |

|
Export the data in a widget to PDF or CSV format. |
Conclusion
Post the completion of this exercise, you should have a good understanding of configuring the dashboard by selecting from various preconfigured widgets from the Dashboard filters section.
Related Documentation
BigFix Runbook AI Configuration Guide
BigFix Runbook AI Troubleshooting Guide