Reports
This section describes how to view component logs, user activity logs, and manage the dashboard in BigFix Runbook AI. It also explains how to evaluate ticket data and view the license report.
Component Logs
This section describes the complete activity logs of BigFix Runbook AI components.
To view the component logs, perform the following steps:
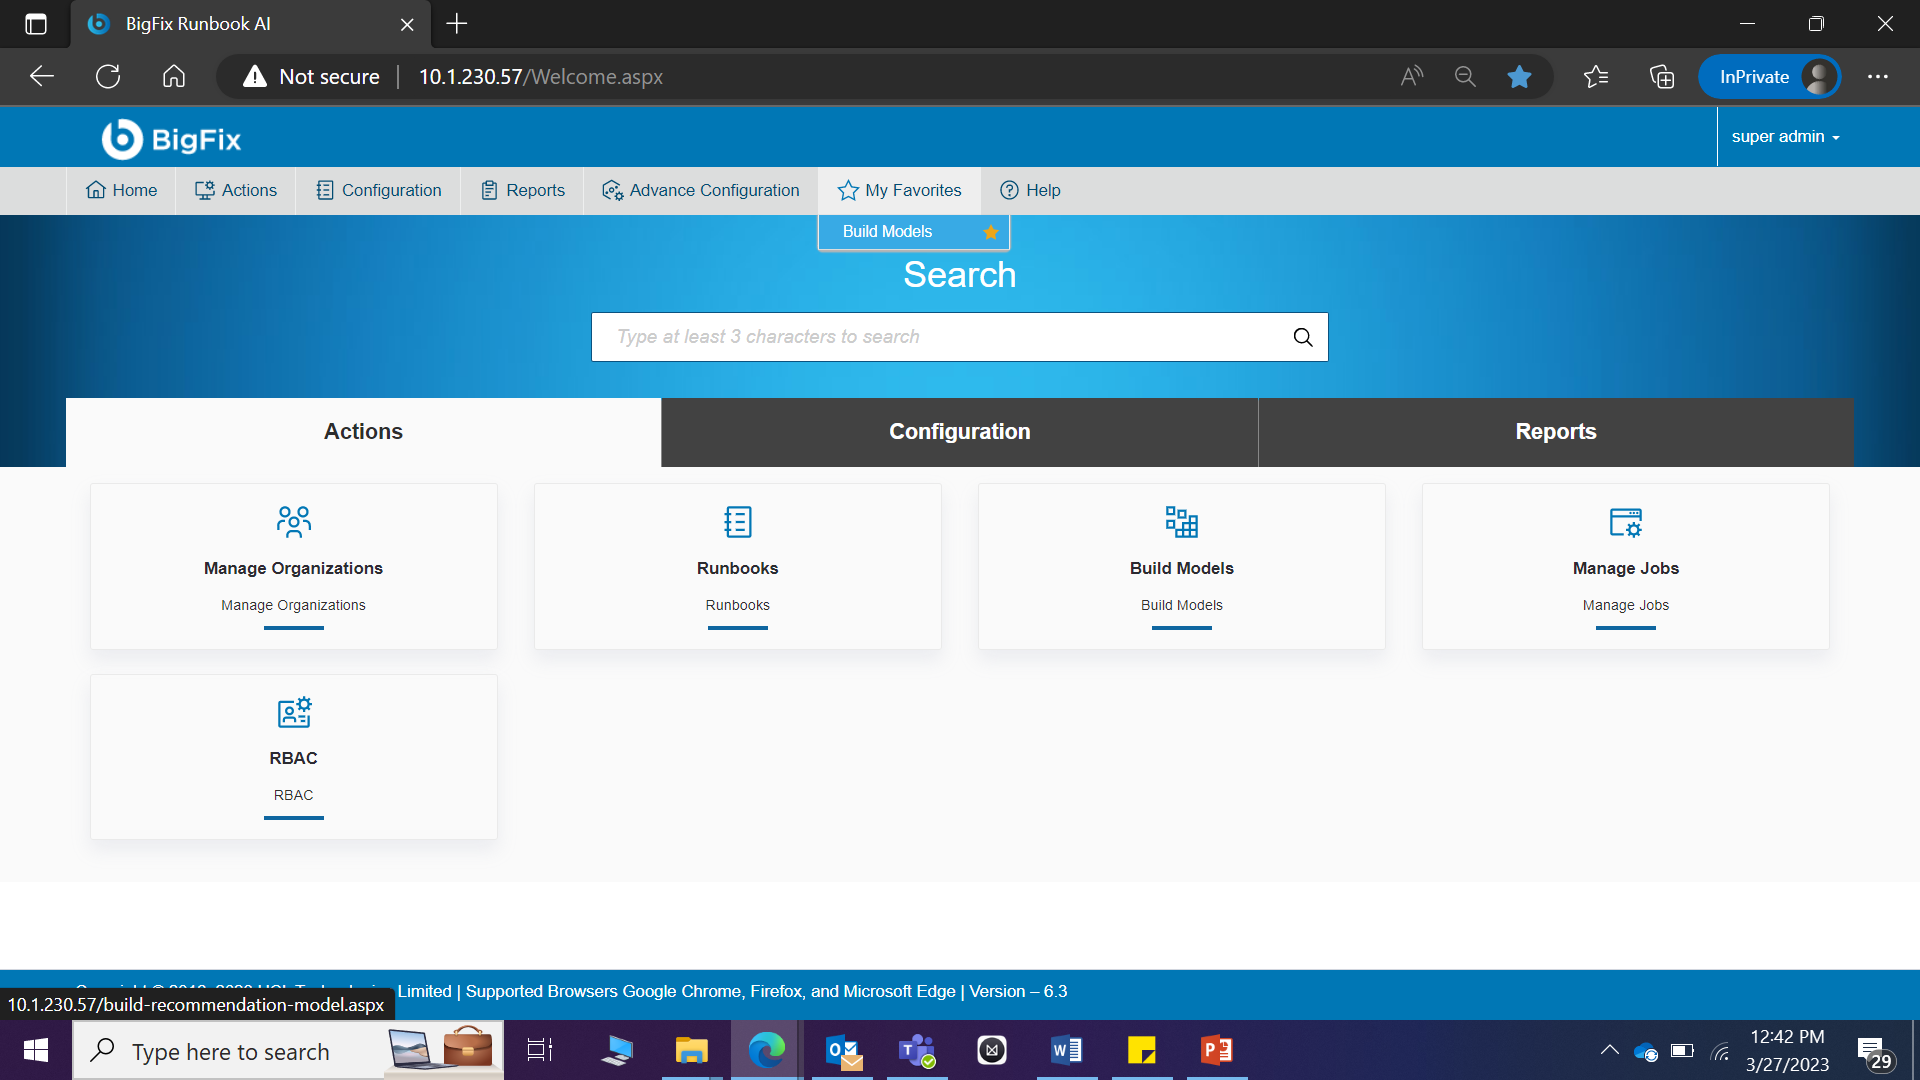
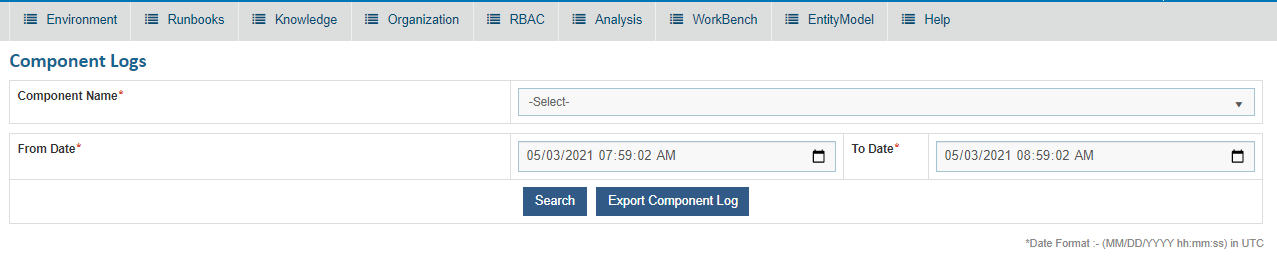
- On main menu bar, click on Reports and the Component Logs.
- Select Component Name, From Date and To Date.
- Click Search.
- The selection lists the relevant logs in a tabular view.
Figure 2. Figure - Component Logs (Cont.) 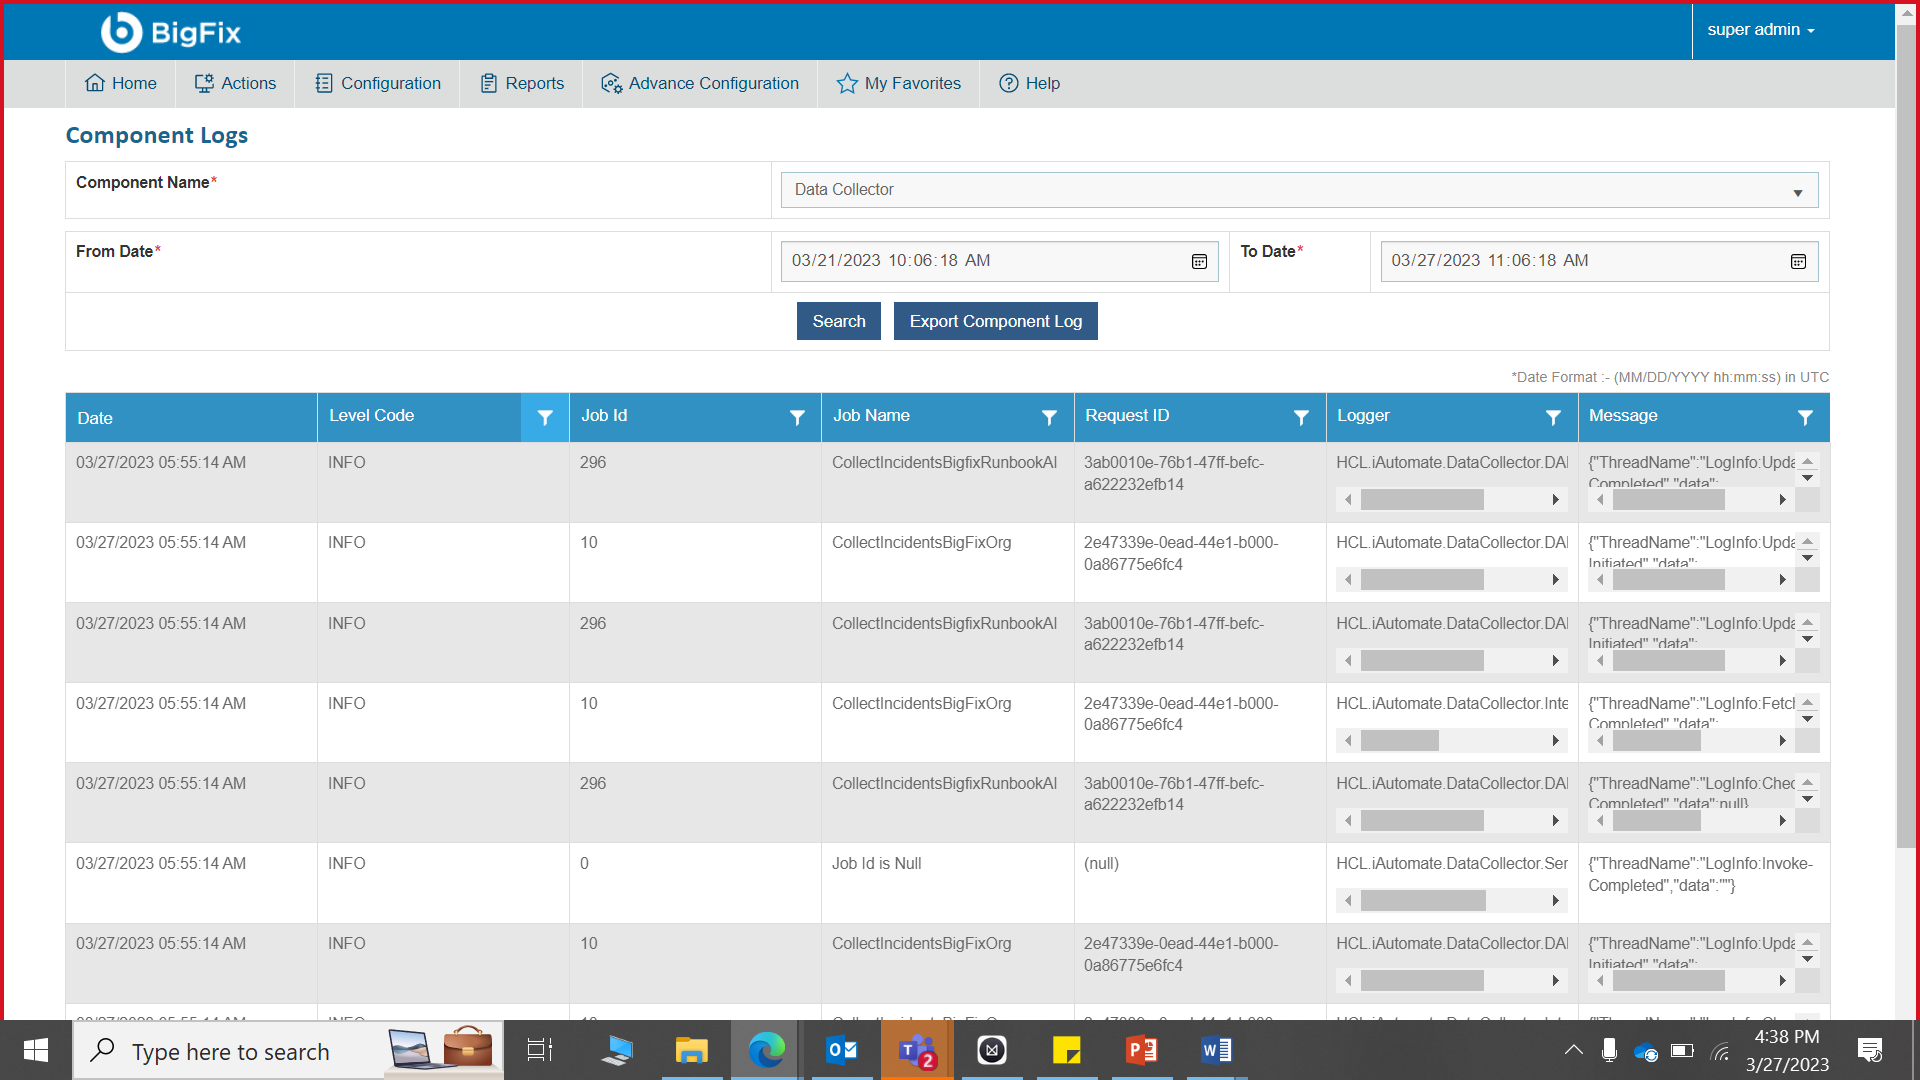
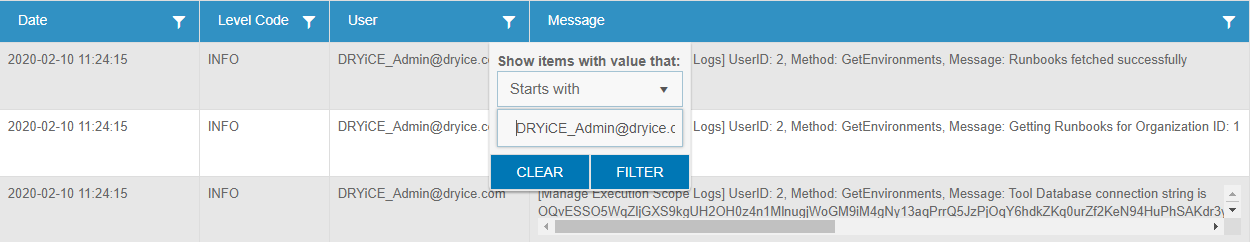
- In case of Website and Web API, below screen appears:
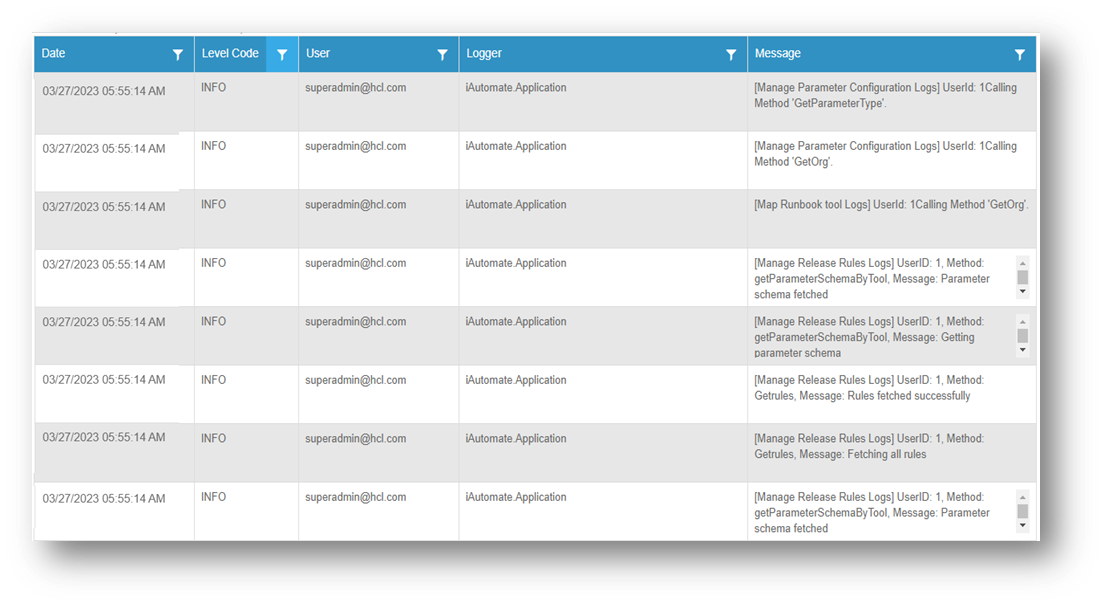
The user can apply filters on the User column. This is available only for Website and Web API only.
User Activity Logs
In this section, users can view the history of user activity using the following steps:
- To view the user activity history in BigFix Runbook AI, click Reports and then click User Activity Logs to access the User Activity Logs page.
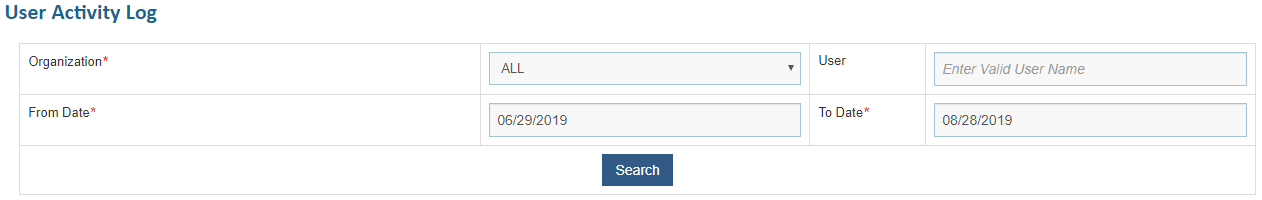
- Click Search to refine the User Activity Logs results. Depending on the application used to access the User Activity Logs, the Organization, User, or Date filter options will be available.
- Select the search options and click Search.
- This displays the filtered user activity log, in a tabular view.
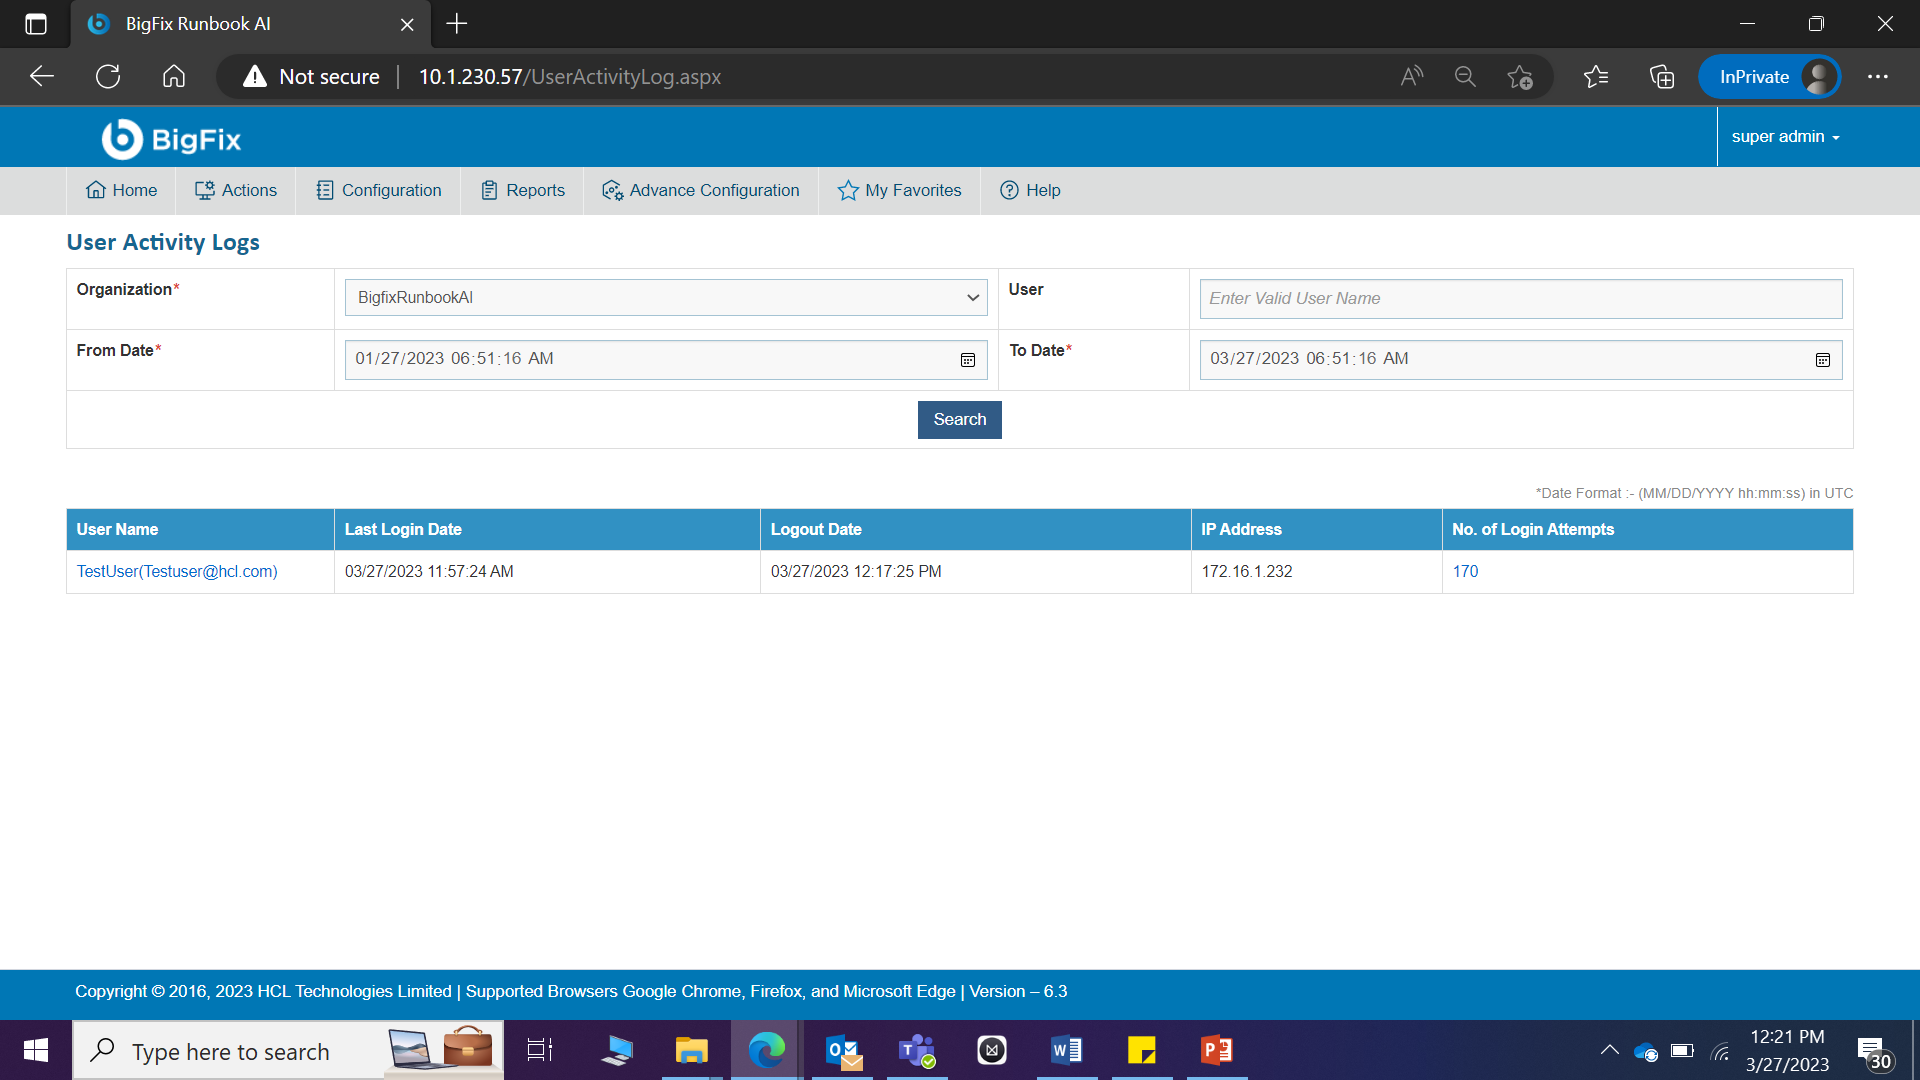
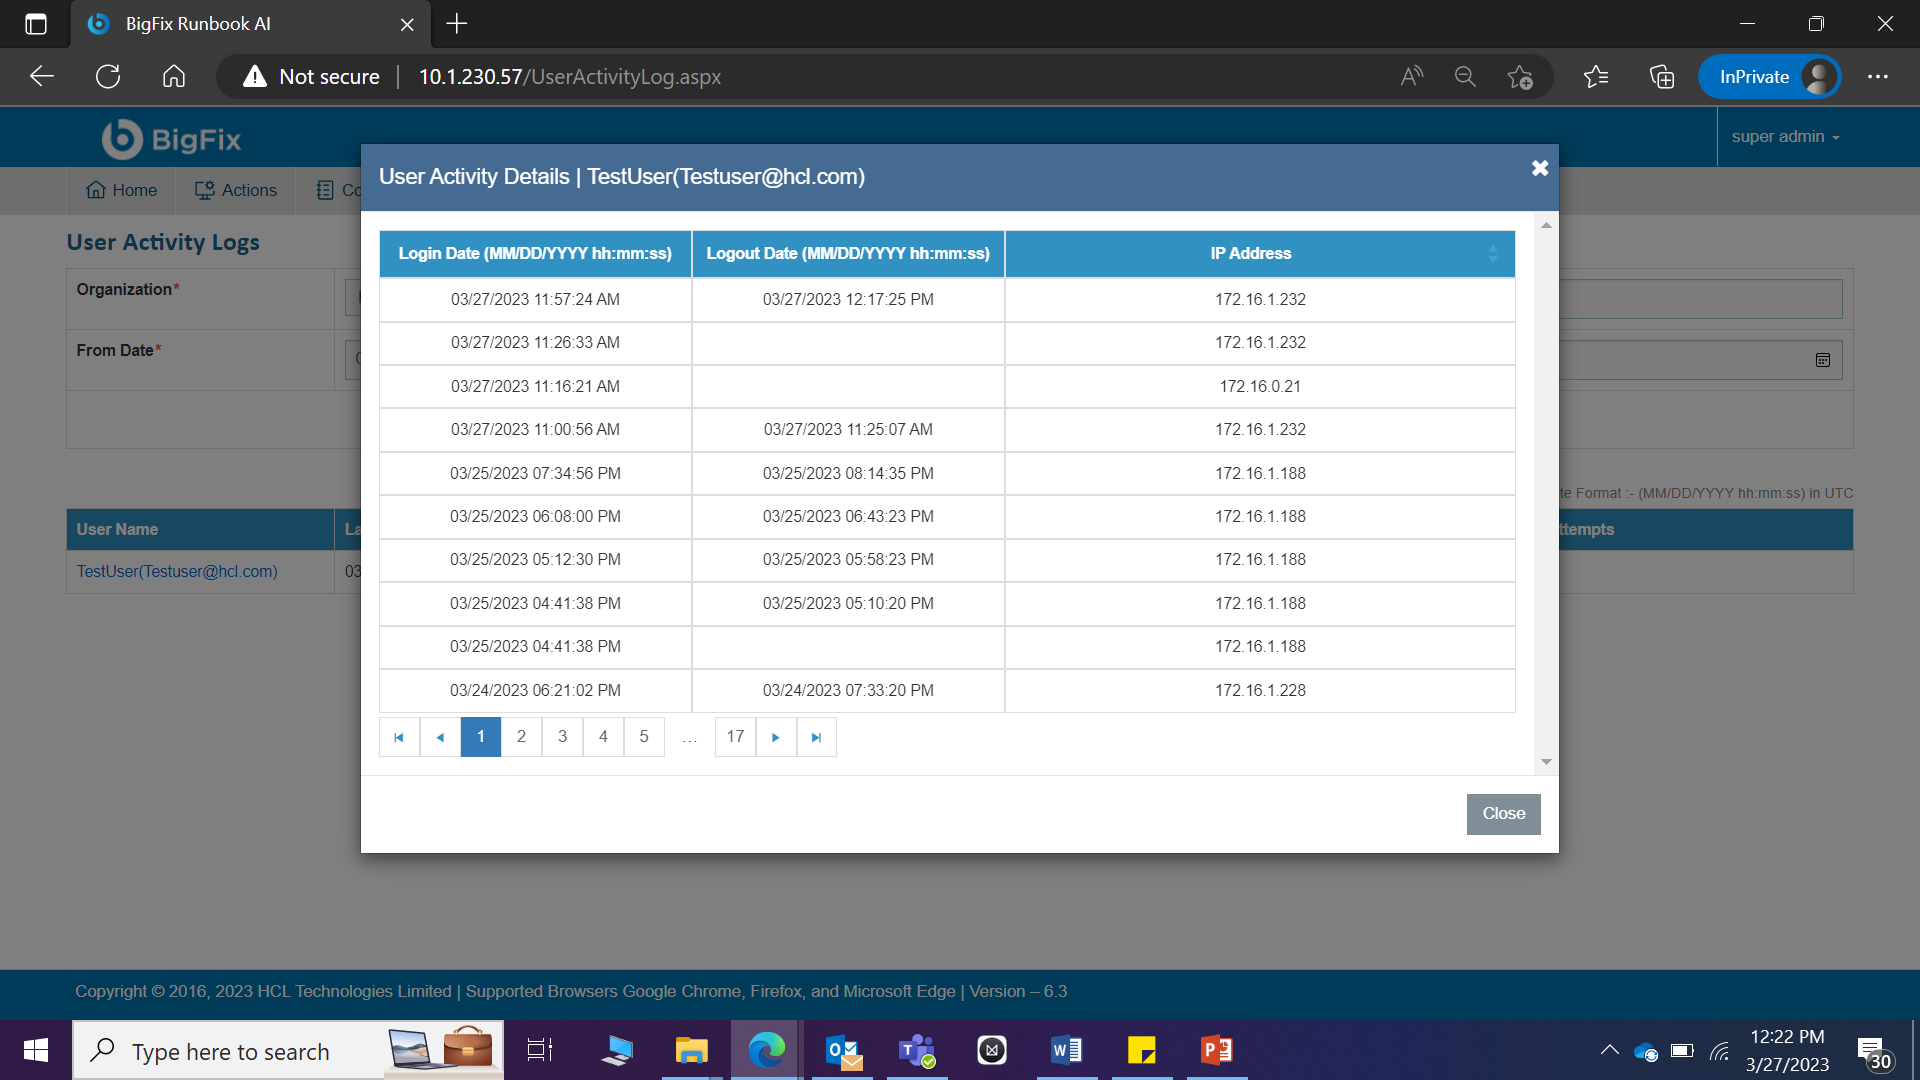
- Selecting a UserName opens the User
Activity Details page displaying the log of all user
activities.
Figure 7. Figure - User Activity Logs (Cont.) 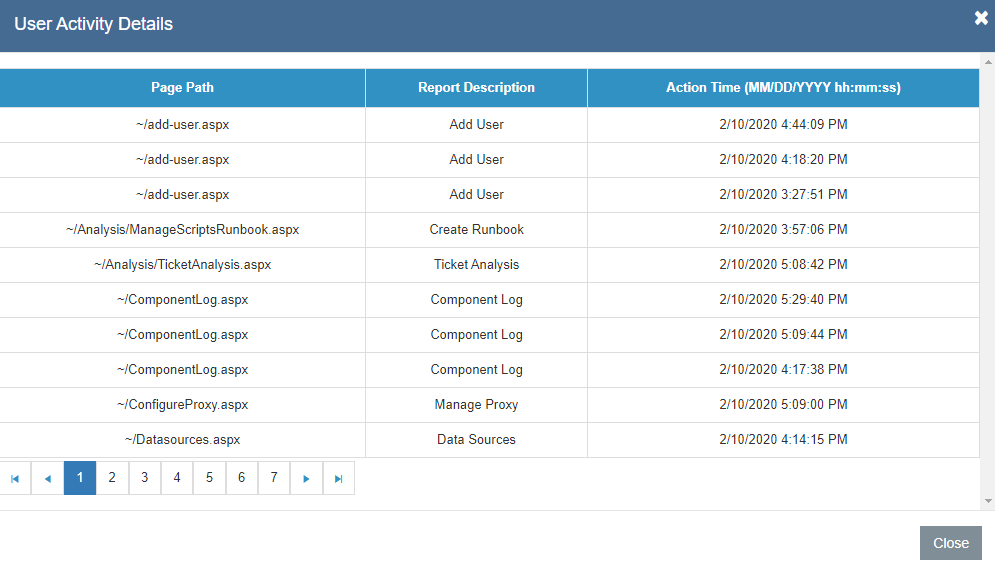
- Selecting the No. of Login Attempts next to a UserName displays the entire log details for all attempts by a particular user.
Dashboard
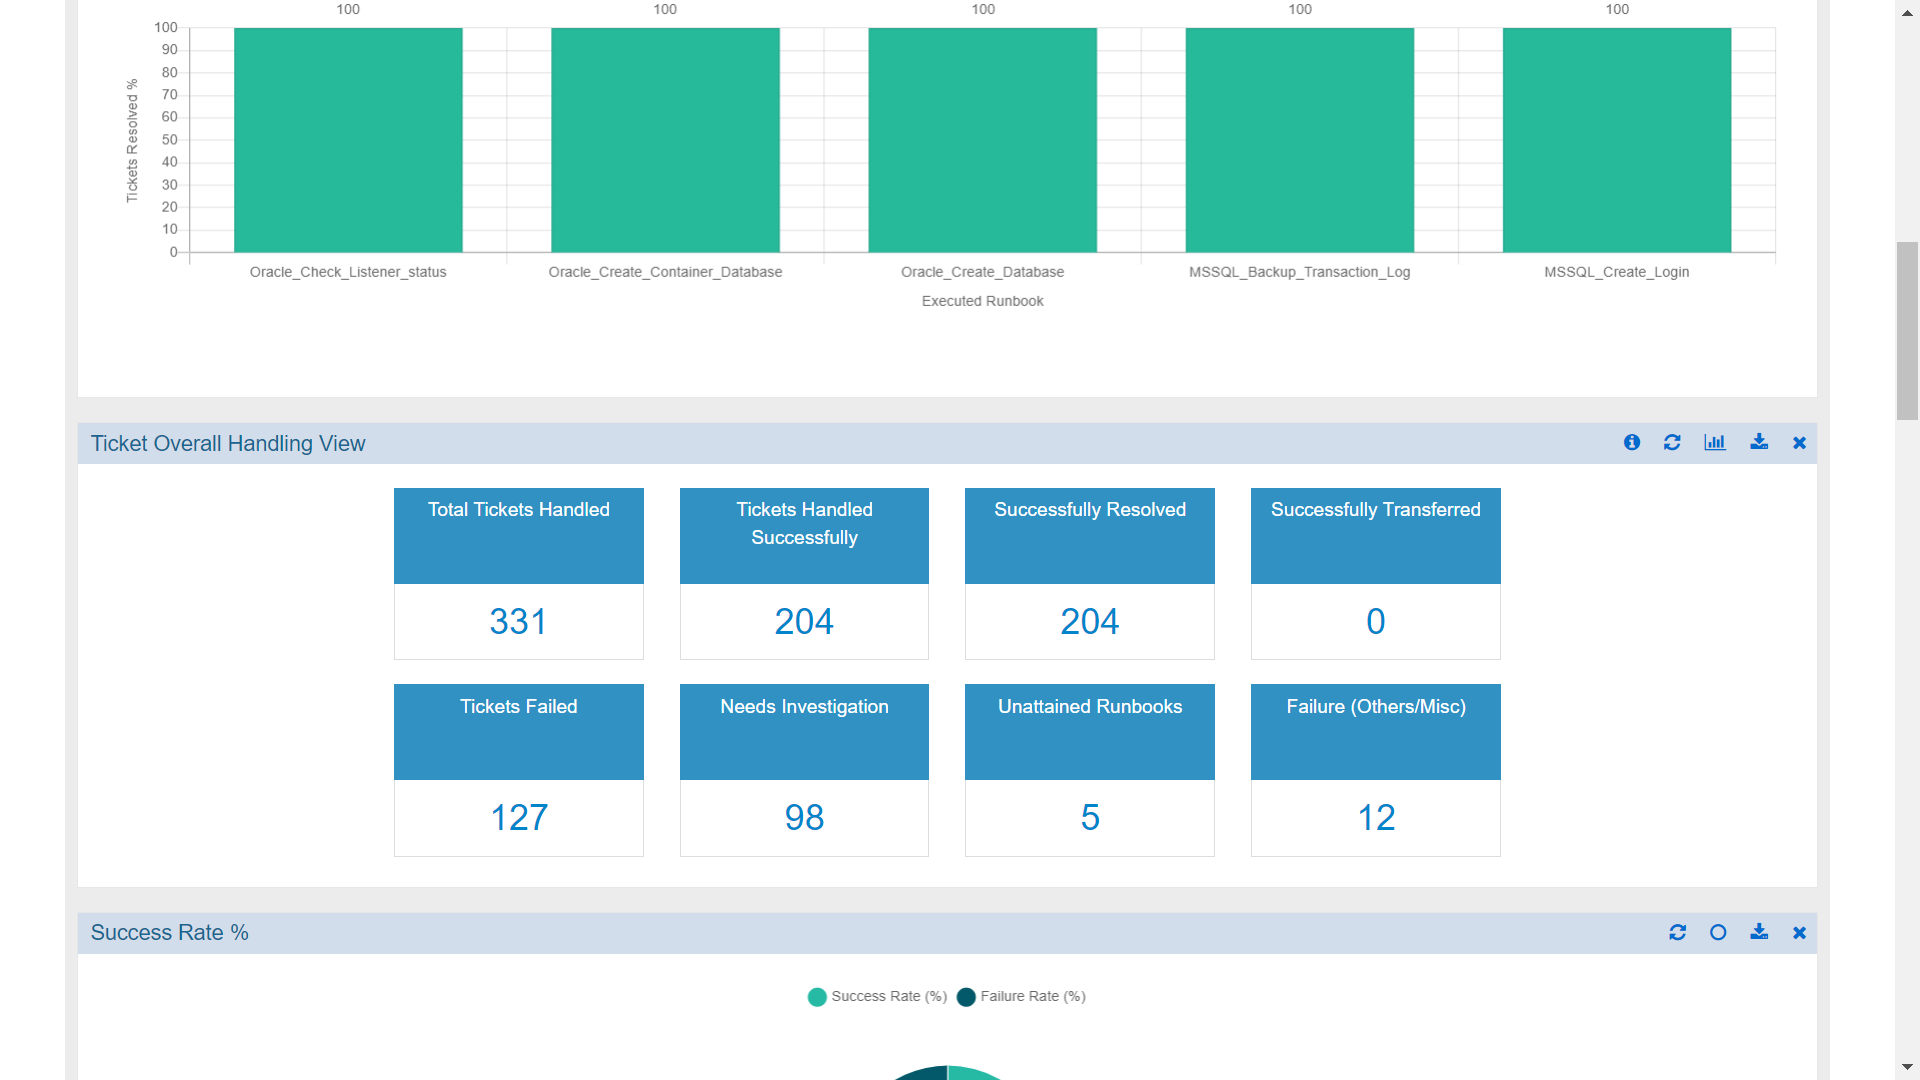
The dashboard provides a complete view of the system in your environment and helps visualize various operational metrics in real time. Each Dashboard User Interface (UI) element can instantly provide additional data insights. You can also create reports using the preconfigured widgets available on the dashboard.
This menu is available to Organization Admin, and Operations Users only.
To manage the dashboard, perform the following steps:
- On the main menu bar, click Reports ->Dashboard . The Dashboard screen displays.
- It displays the predefined widgets in the Dashboard Filters pane. User can add new widgets from the predefined widgets and change or remove existing widgets from the organization.

Set Dashboard as Default Page
User can set the dashboard page as default page so that when user logs into BigFix Runbook AI, the first page that opens by default is Dashboard page.
For that, go to Dashboard page and click on Set Default checkbox.
An alert will be generated:
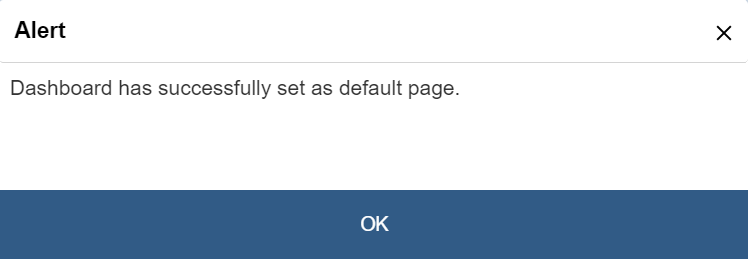
Once dashboard page is set as default page by the user, now every time the same user logs into BigFix Runbook AI, the dashboard page will be opened as home page.
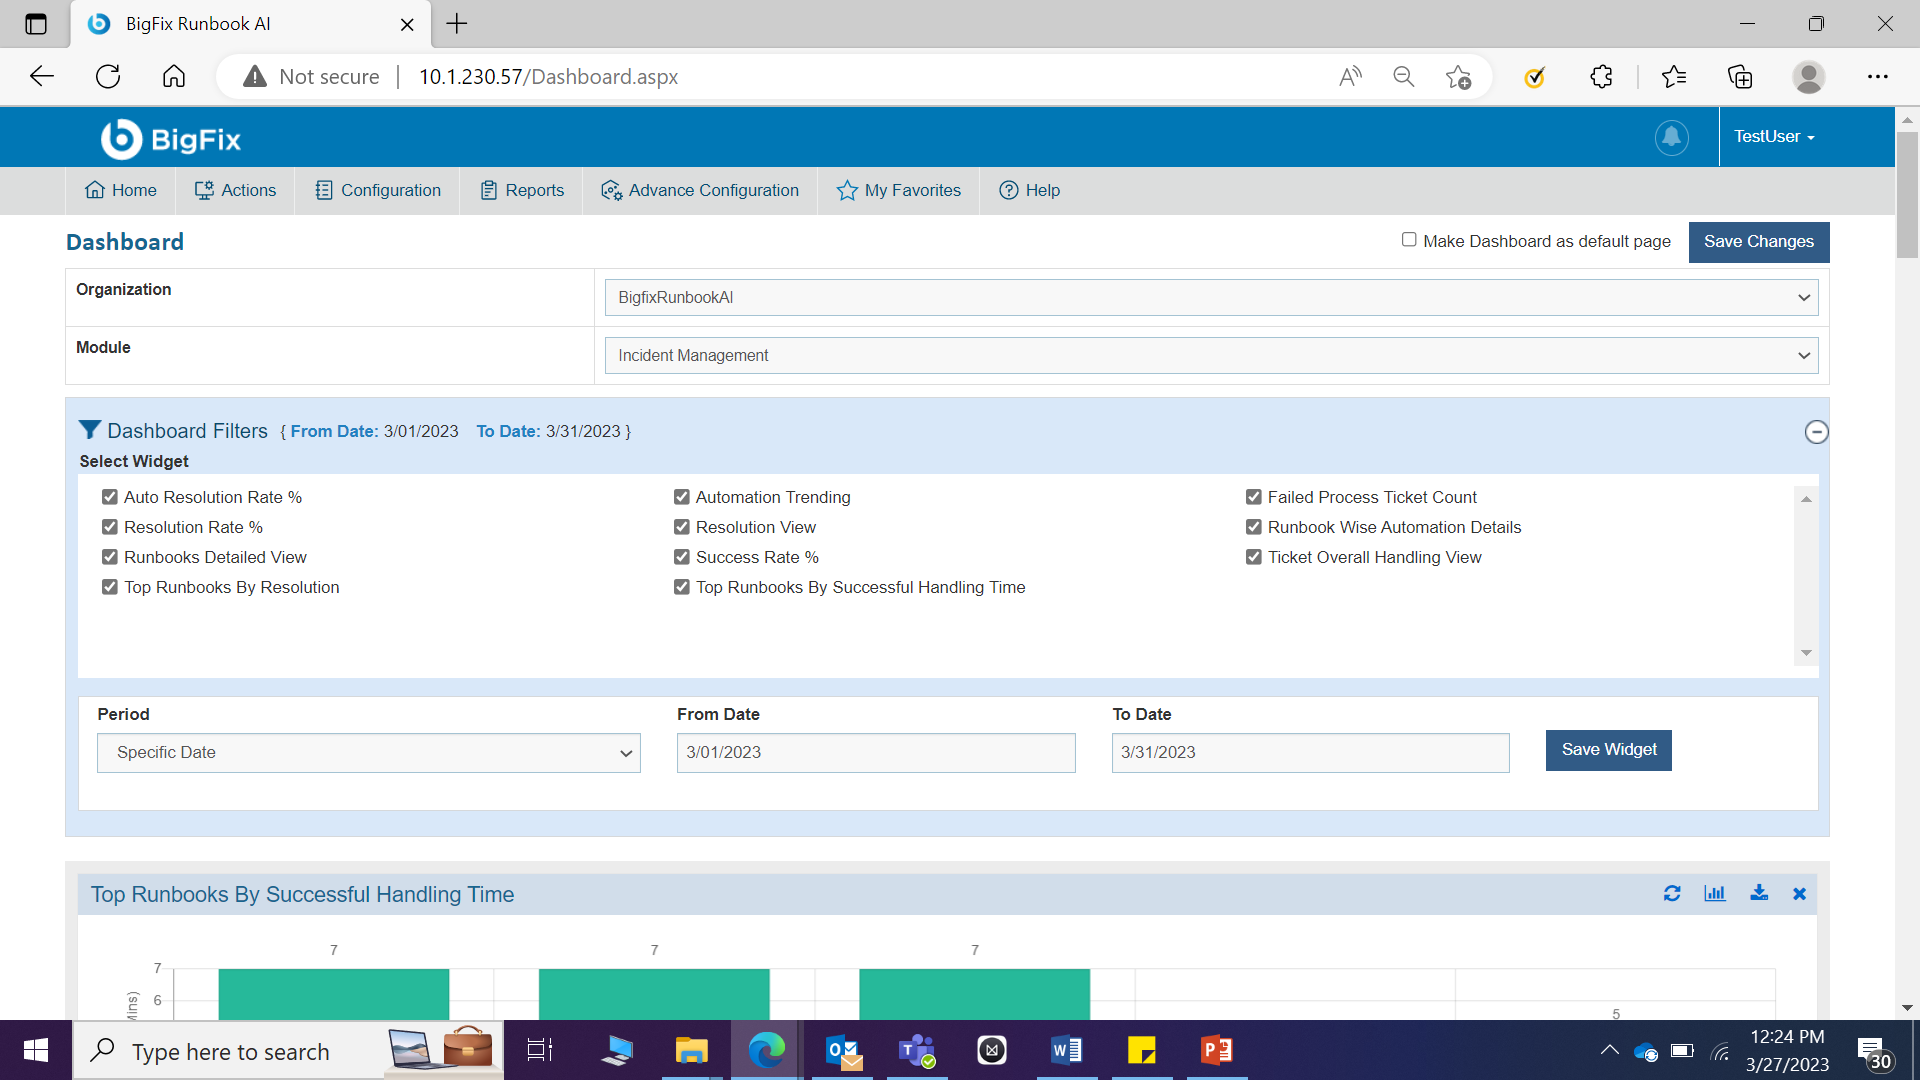
Add Widget
Dashboard customization is allowed for users with the appropriate privileges. To add more reports or data to a dashboard, user can define widgets for the selected organization.
To add a widget into an organization, perform the following steps:
- On the Dashboard screen, select an Organization.
- If there are any configured widgets in the selected
organization, they appear in the Dashboard Filters
pane.
- To add a widget, click
 on the Dashboard
Filters pane and list the predefined widgets.
on the Dashboard
Filters pane and list the predefined widgets.
Figure 13. Figure - Add Widget .png)
Preconfigured widgets list all the KPIs that a user can use to create their view.
- Select the required widgets by selecting the corresponding check box and then click Save Widget.
Figure 14. Figure - Add Widget (Cont.) 
To delete a widget from the selected organization, clear the widget check box, and then click Save Widget to save the changes.
- To add a widget, click
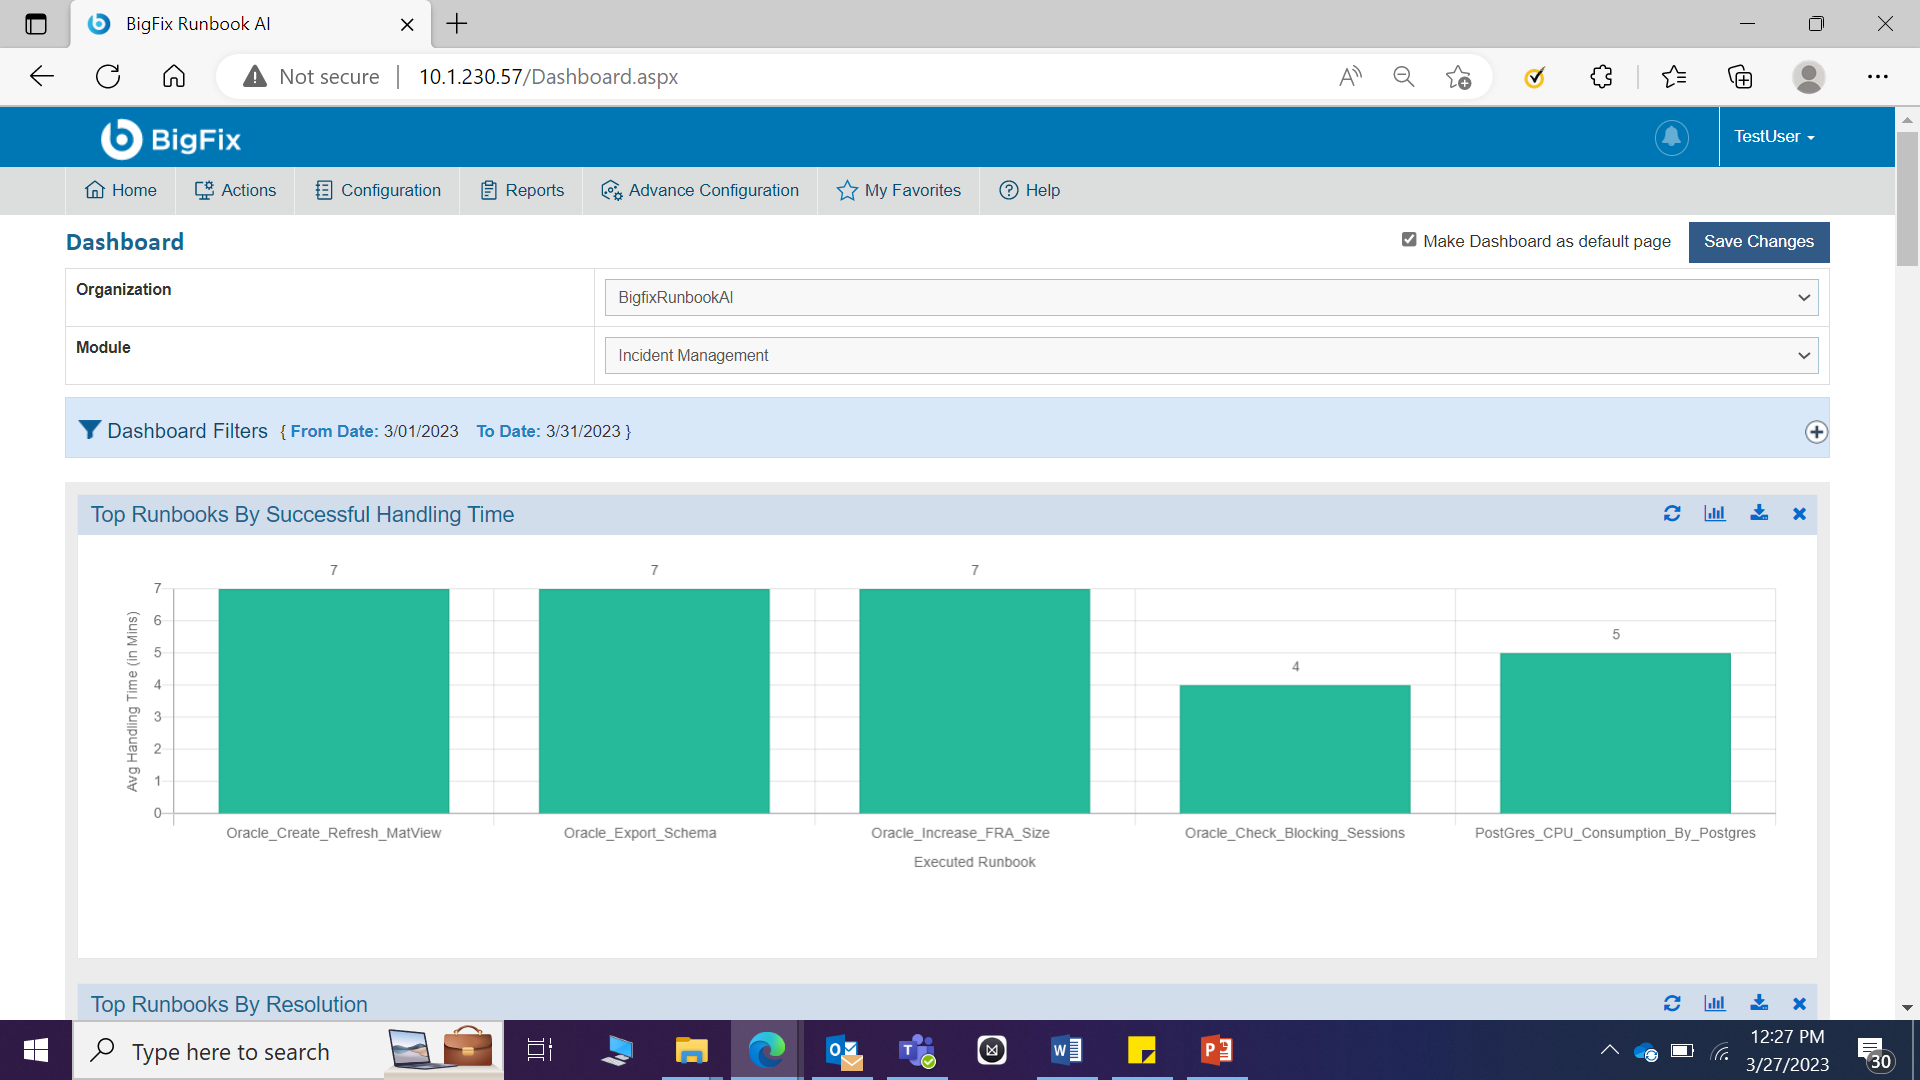
- The added widgets are displayed on the dashboard.
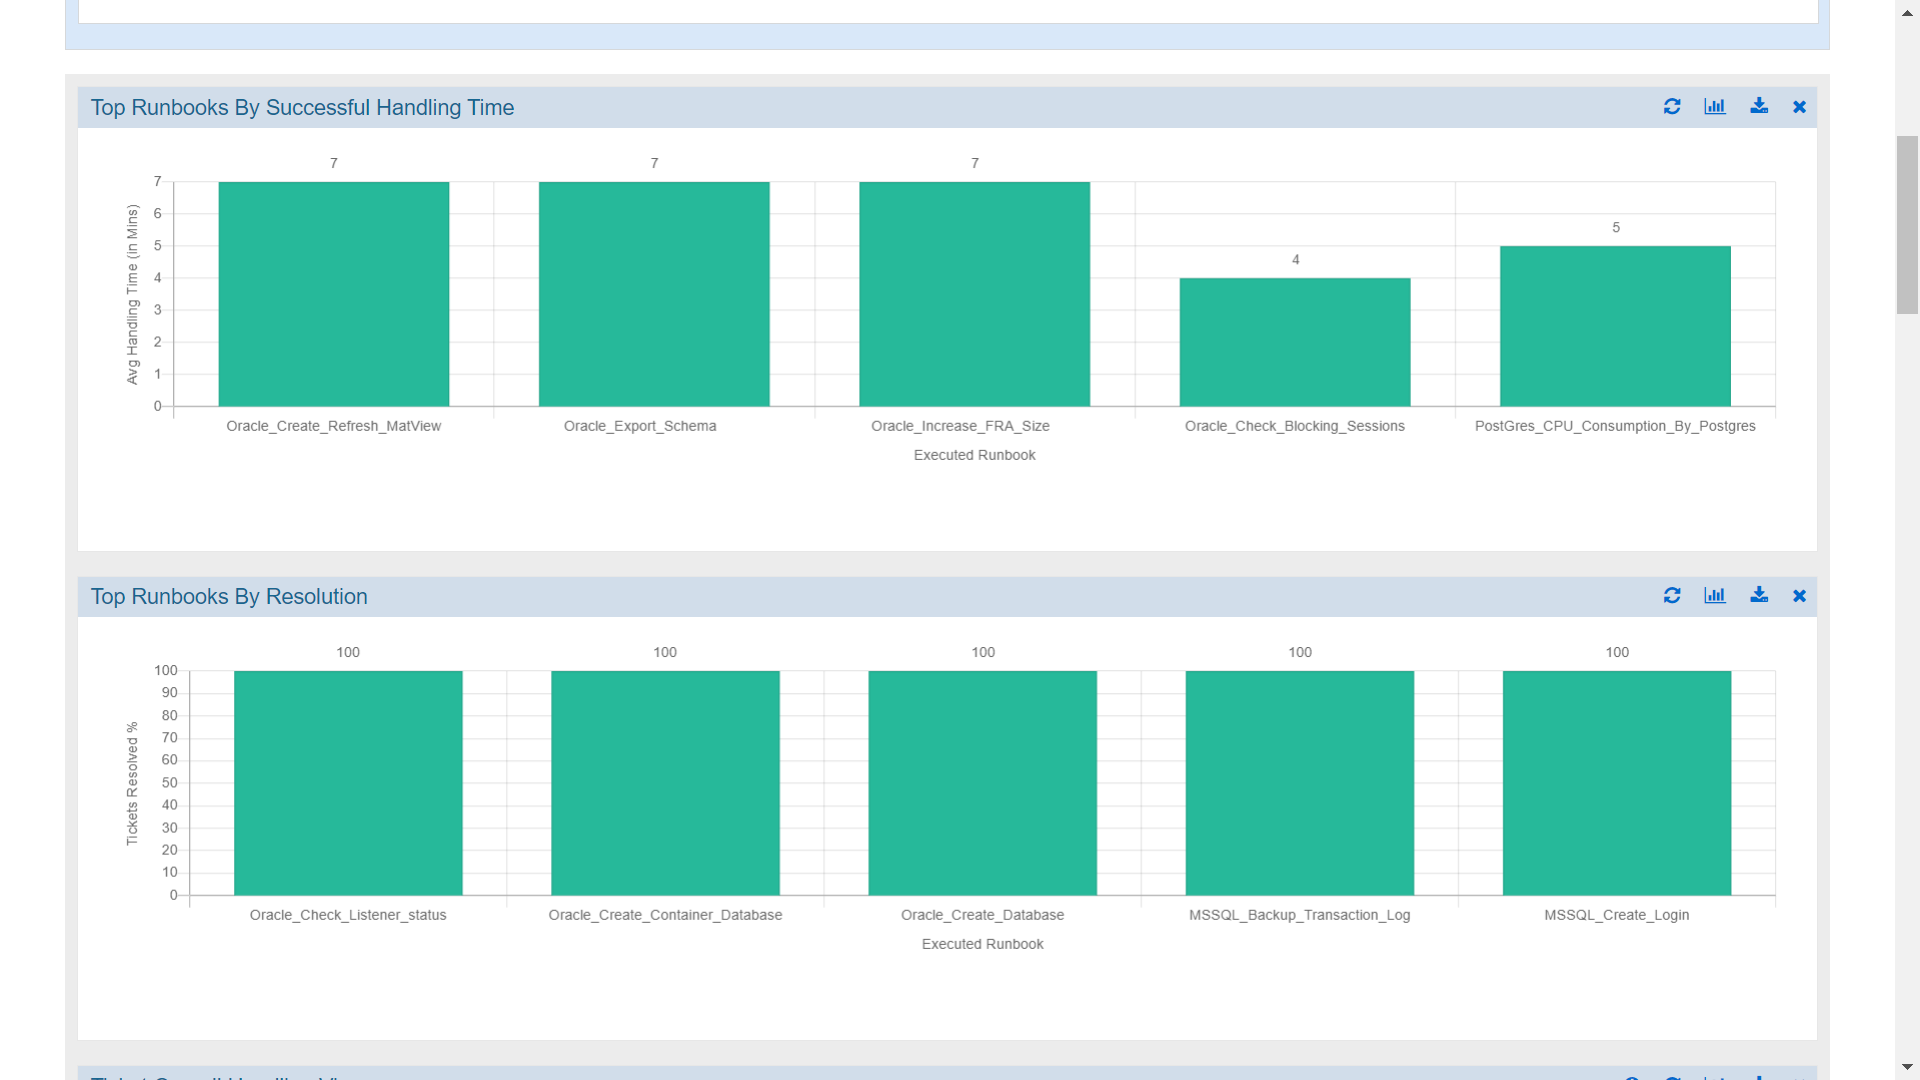
User can view drill-down details of any report appearing on the widget by clicking a specific data point on the widget. This allows user to explore multi-dimensional data by navigating down one level to view more details.
To view the drill-down report, click any visualization to view the drill-down report appearing on a widget.
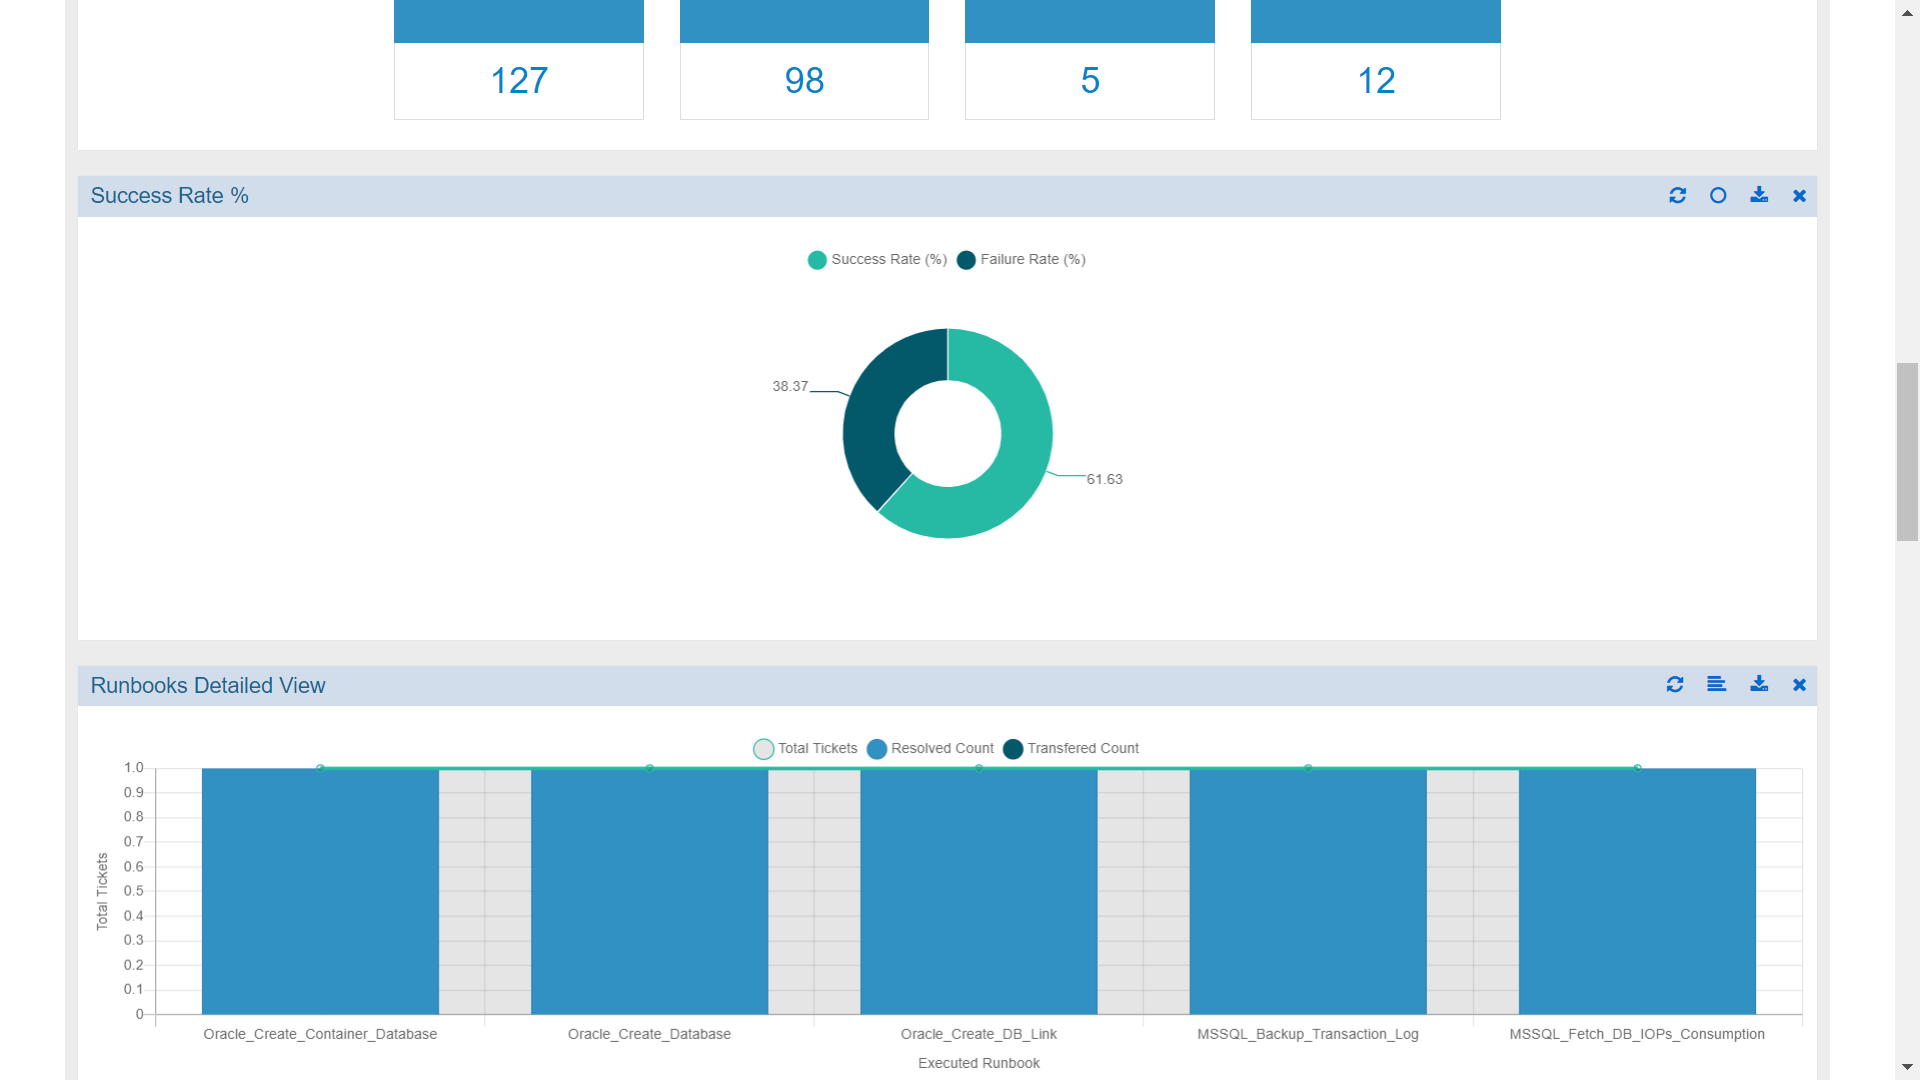
The drill-down report displays on the screen.
Each widget can be resized by performing the following steps:
- Point at any corner of the selected tab with the mouse pointer. When the pointer turns into a double-headed arrow, hold down the primary mouse button and drag the corner in or out to resize the window. Release the mouse button after resizing the window.
- Click Save Changes.
Each widget can be moved by performing the following steps:
- Click a blank portion on the navigation bar of the selected tab.
- Hold down the primary mouse button and then drag the mouse pointer to the place on the screen where you want the tab. After you move the mouse pointer to the position on your screen where you want the taskbar, release the mouse button.
- Click Save Changes.
The navigation bar on each widget contains the following menus.
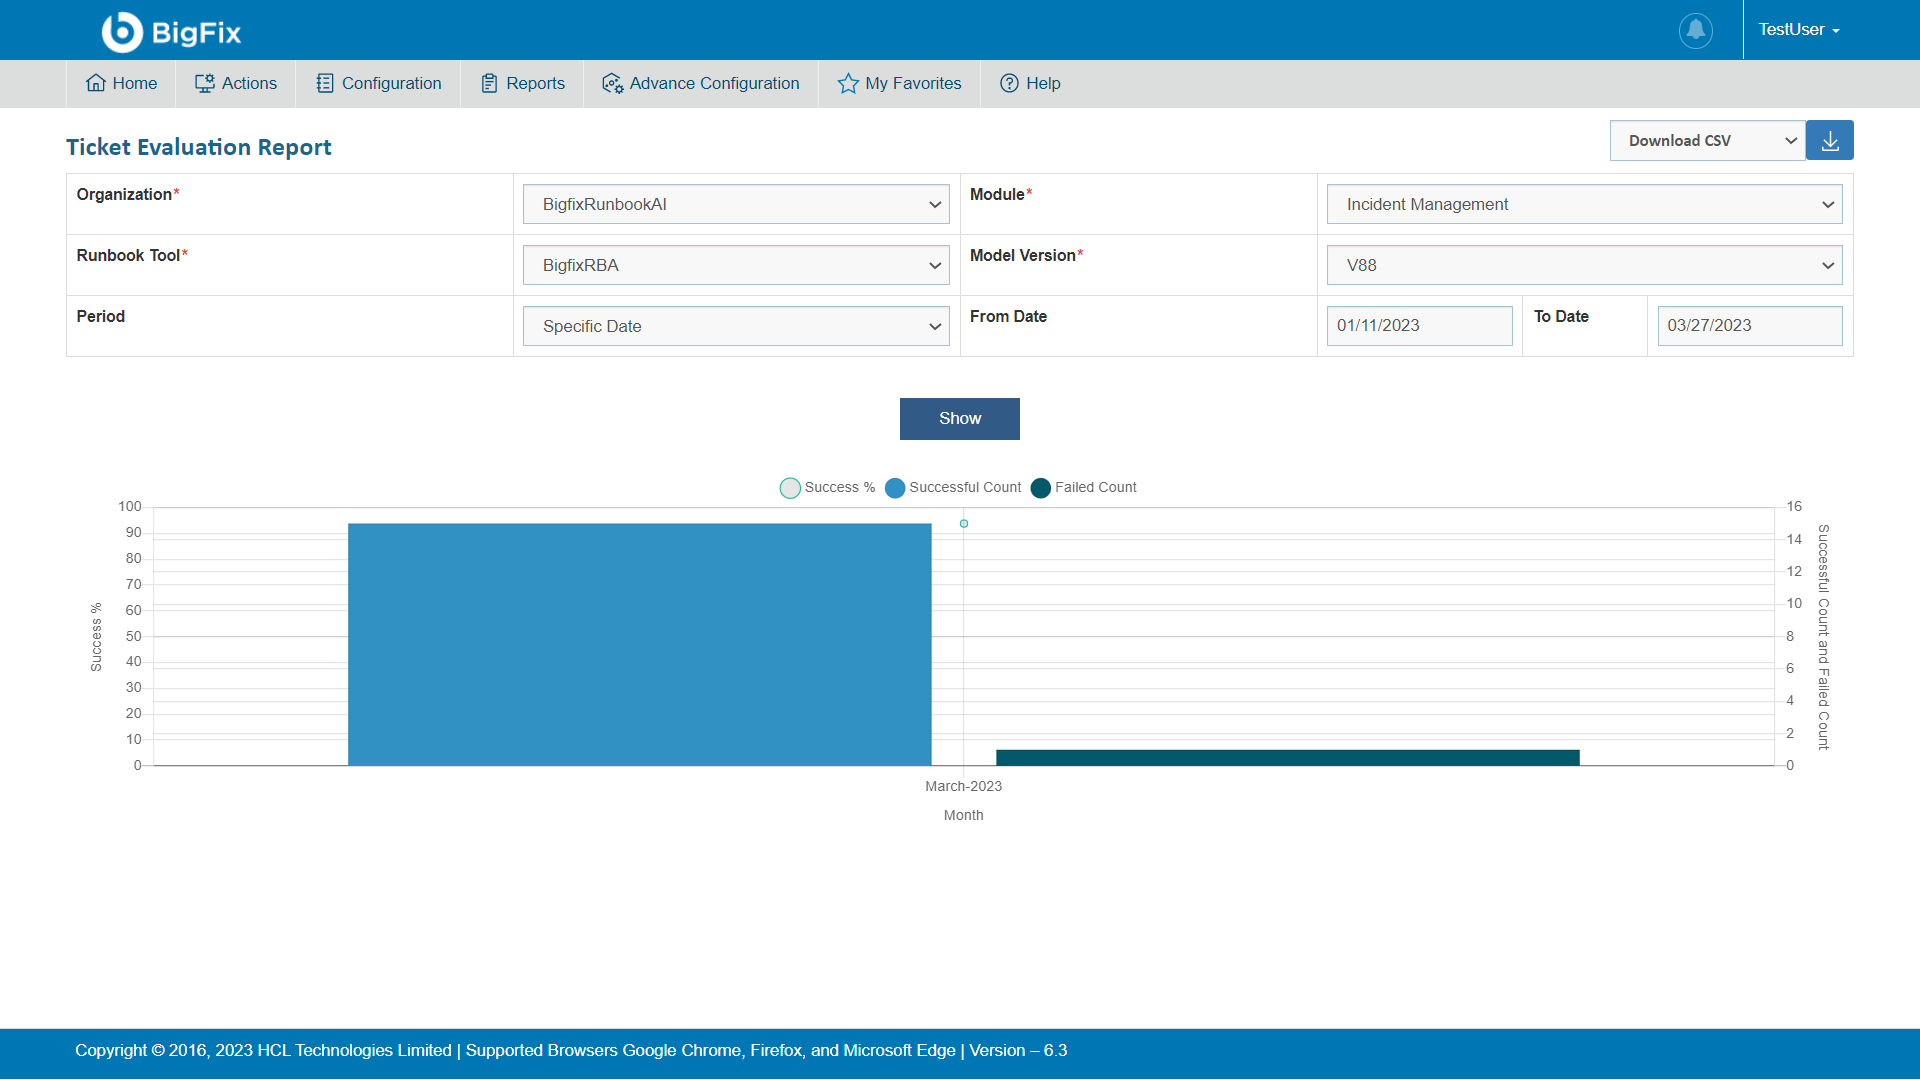
Ticket Evaluation Report
User can evaluate any built model for an organization, its module, and the mapped runbook tool.
- On the main menu bar, Click Reports and then click Ticket Evaluation Report.
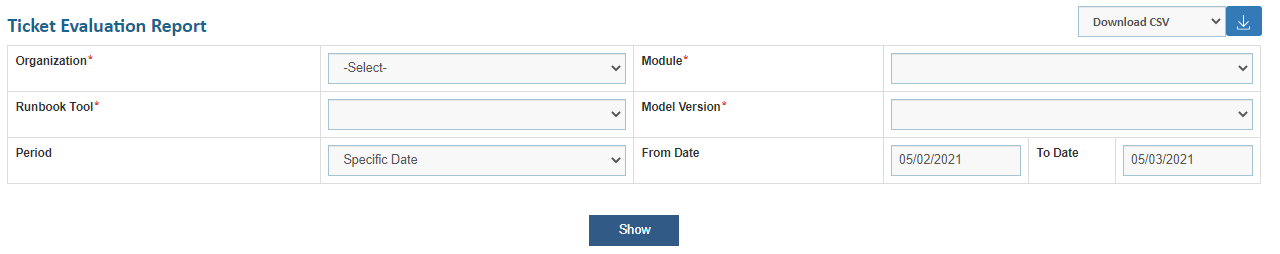
- Select Organization, Module, Runbook Tool, Model Version, and the time for which user needs to see the data.
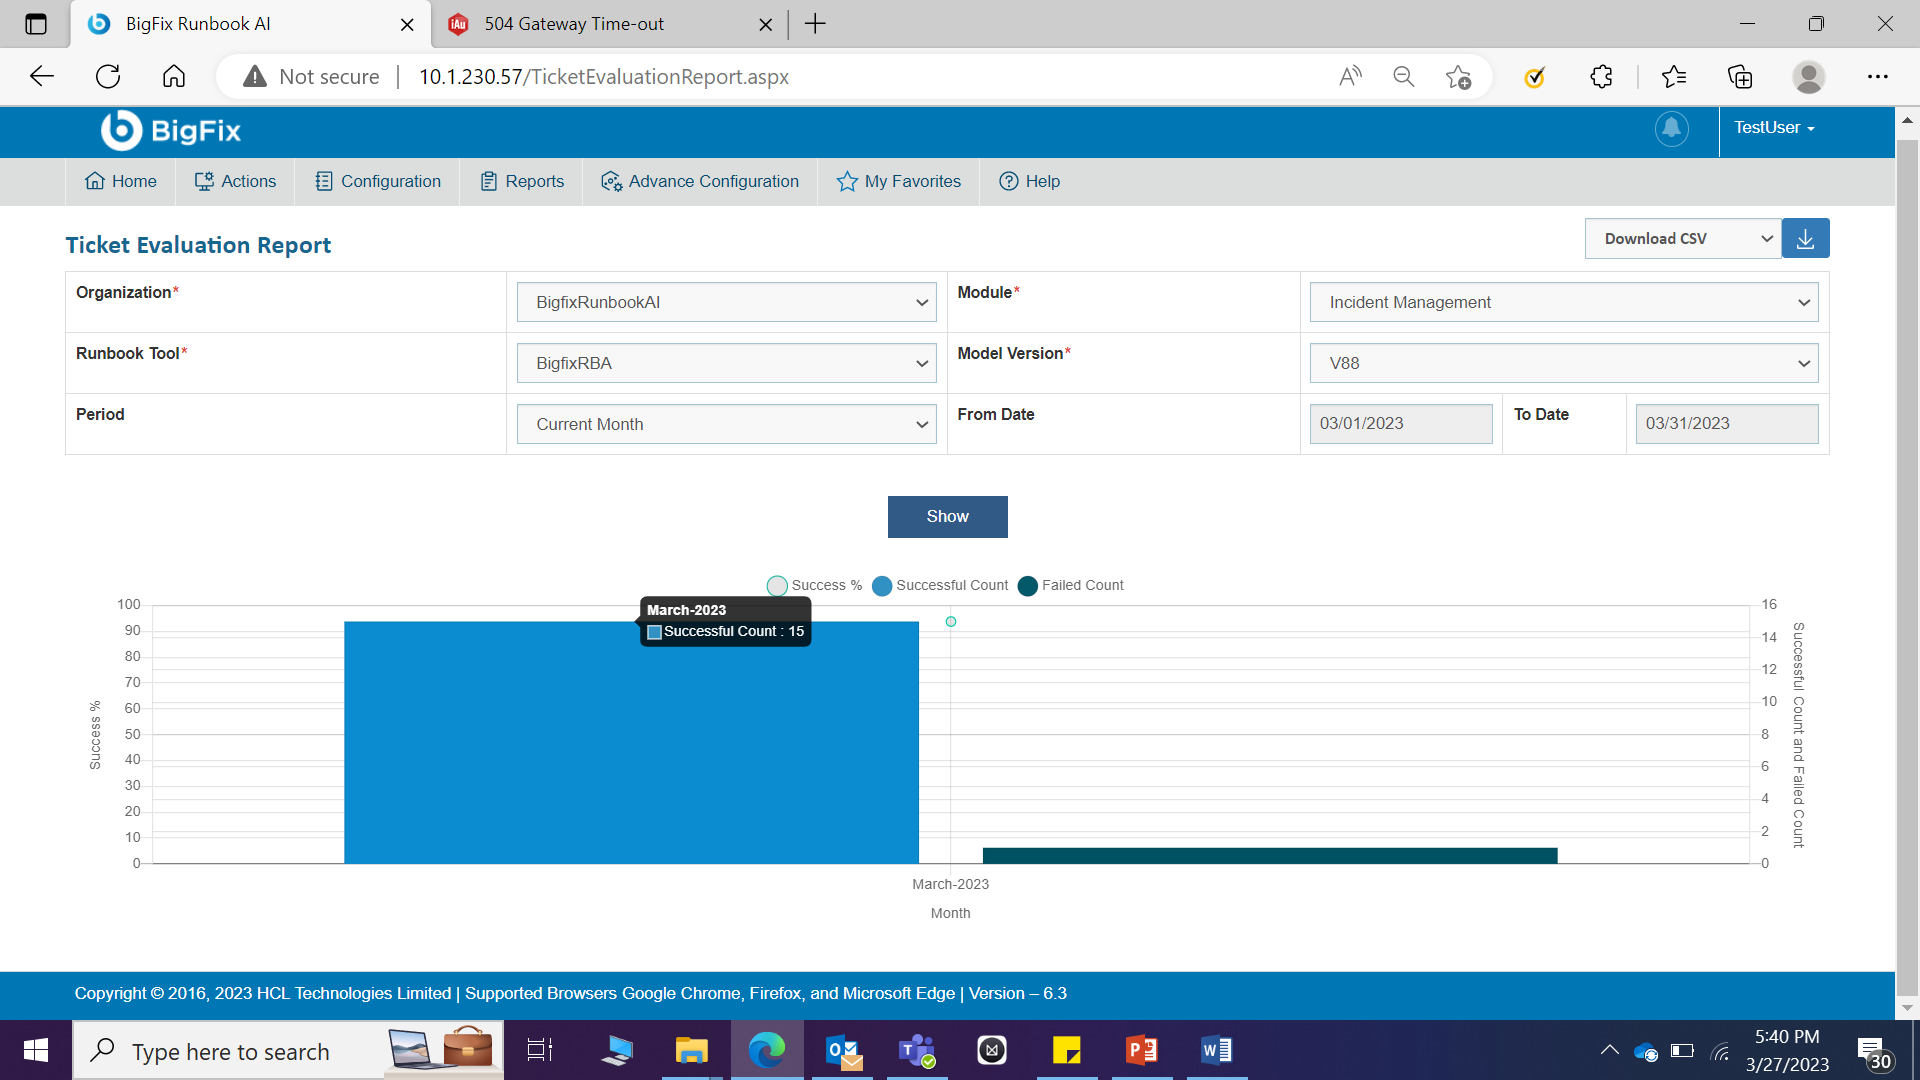
- Then click on Show. All the ticket data that has been processed during the selected time will be shown in the form of a graph with Month on x-axis, Success % on left y-axis and Success Ticket and Failed Ticket count on right y-axis.
- When hovered on Successful Count graph, it displays the no. of successful tickets for the defined period. When hovered on Failed Count graph, it displays the no. of failed tickets for the defined period and when hovered on the Success %, it shows the percentage of successful tickets for the mentioned period.
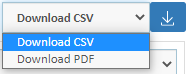
- User can download this information in the form of CSV or PDF.
For this, select either Download CSV or
Download PDF and click on button
 .
.
- To get the detailed information for any block of data, click on that block. A popup will be opened that displays the No. of tickets, Bucket Description, Bucket Detail, Published Duration, Success (%), and Fail (%).
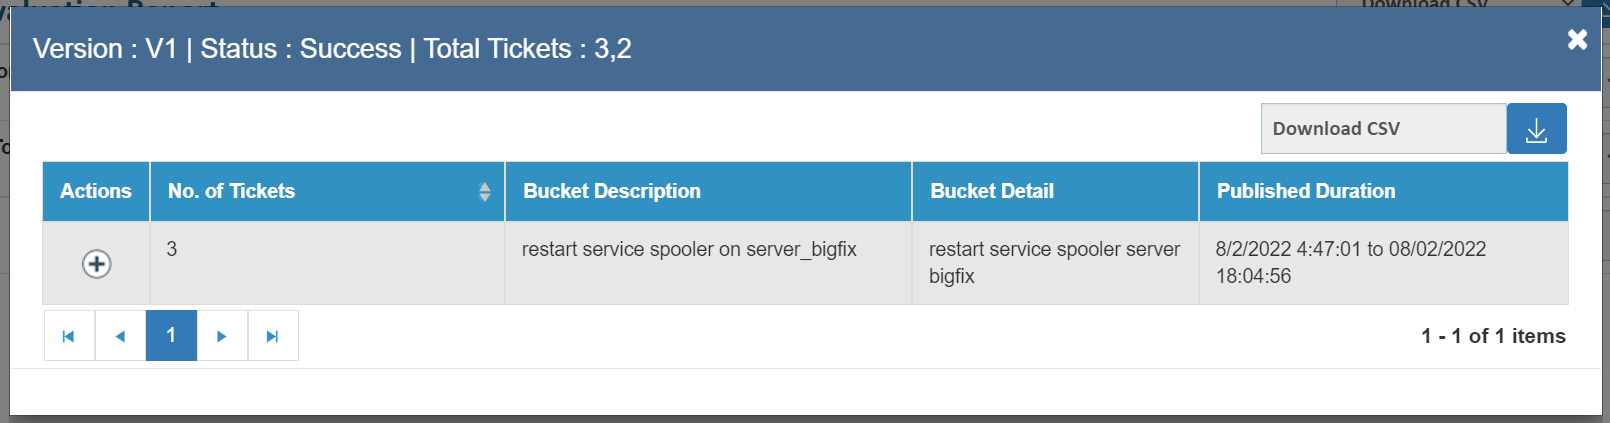
- Click on
 icon to get the
ticket details for that bucket description along with
Ticket Number, its Description,
Remarks, Executed Runbook on that
ticket and Recommended Runbook List for that
ticket.
icon to get the
ticket details for that bucket description along with
Ticket Number, its Description,
Remarks, Executed Runbook on that
ticket and Recommended Runbook List for that
ticket.
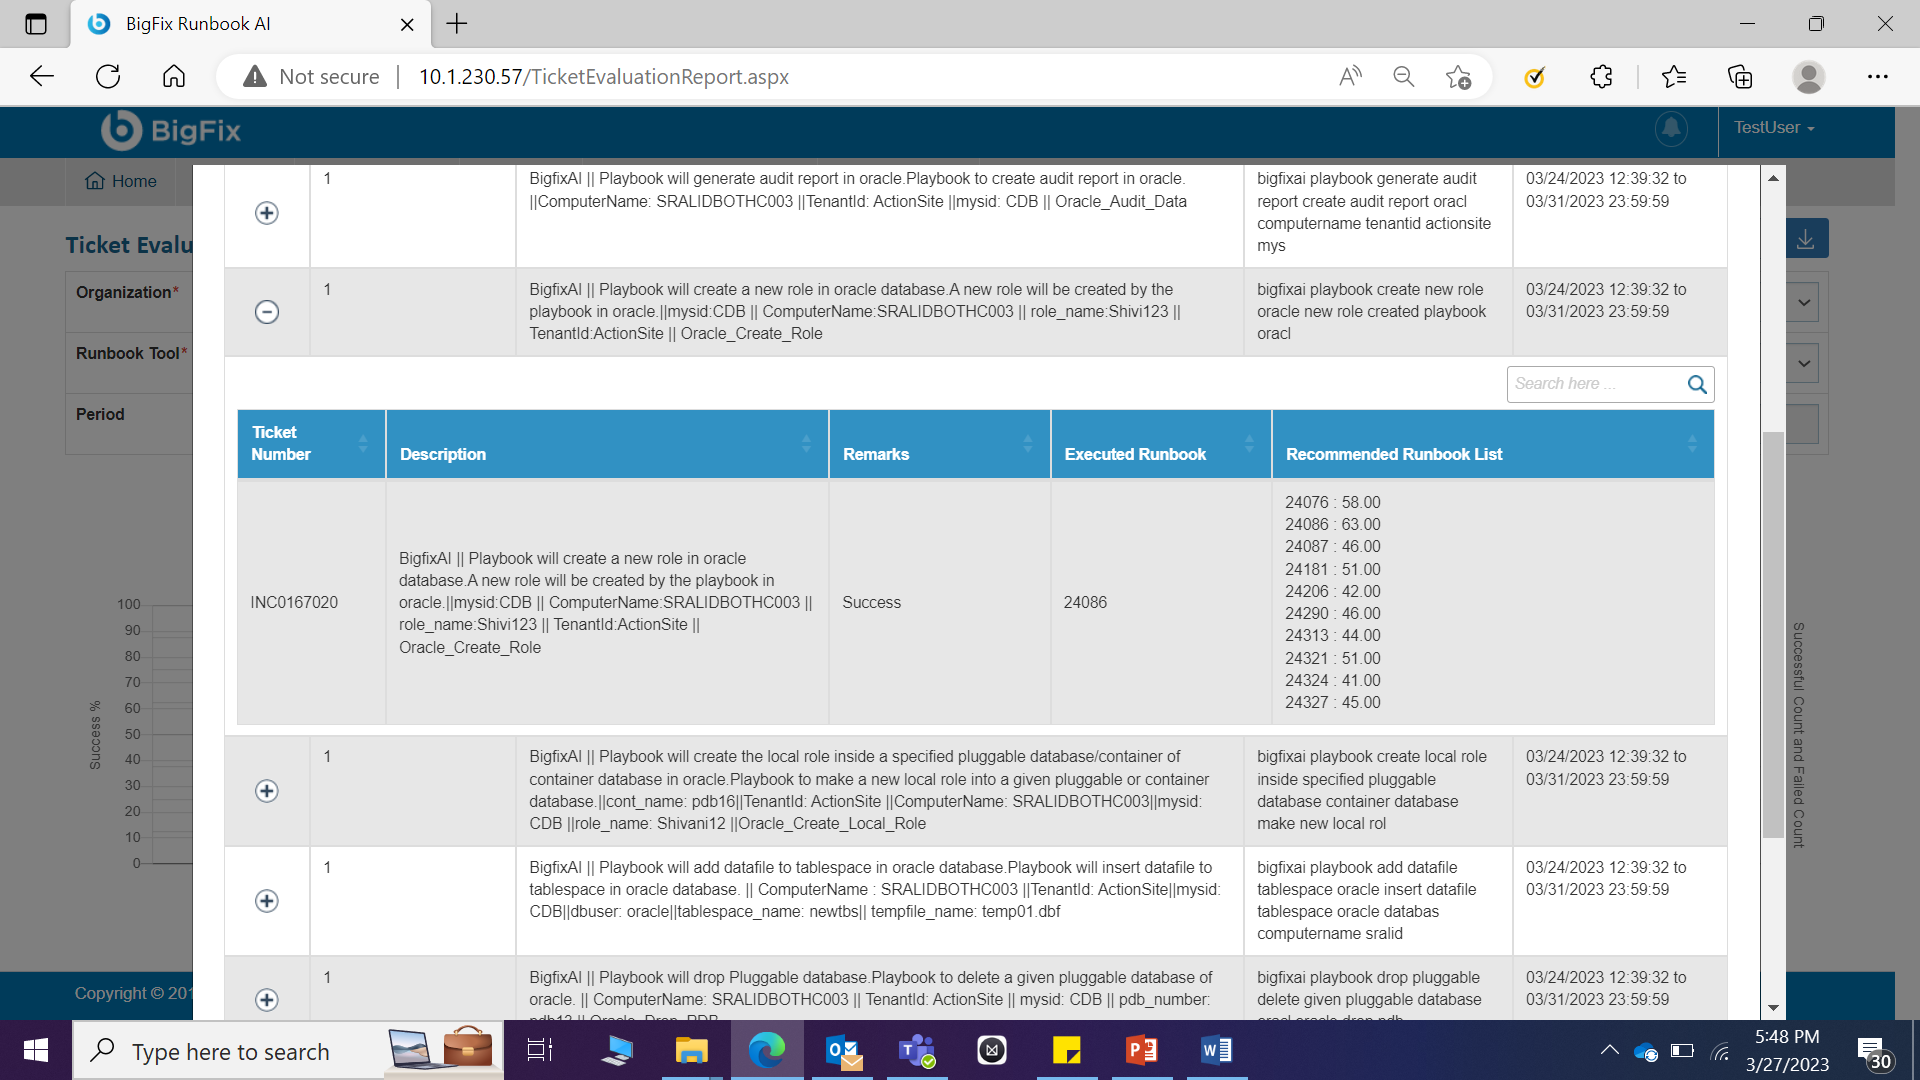
- User can also download this ticket information in the form of
CSV. For this, click on button
 next to
License Report
This screen shows the information regarding Licensing of the product and CI usage and entitlement.
- On the main menu bar, Click Reports and then
click License Report.
Figure 24. Figure - License report 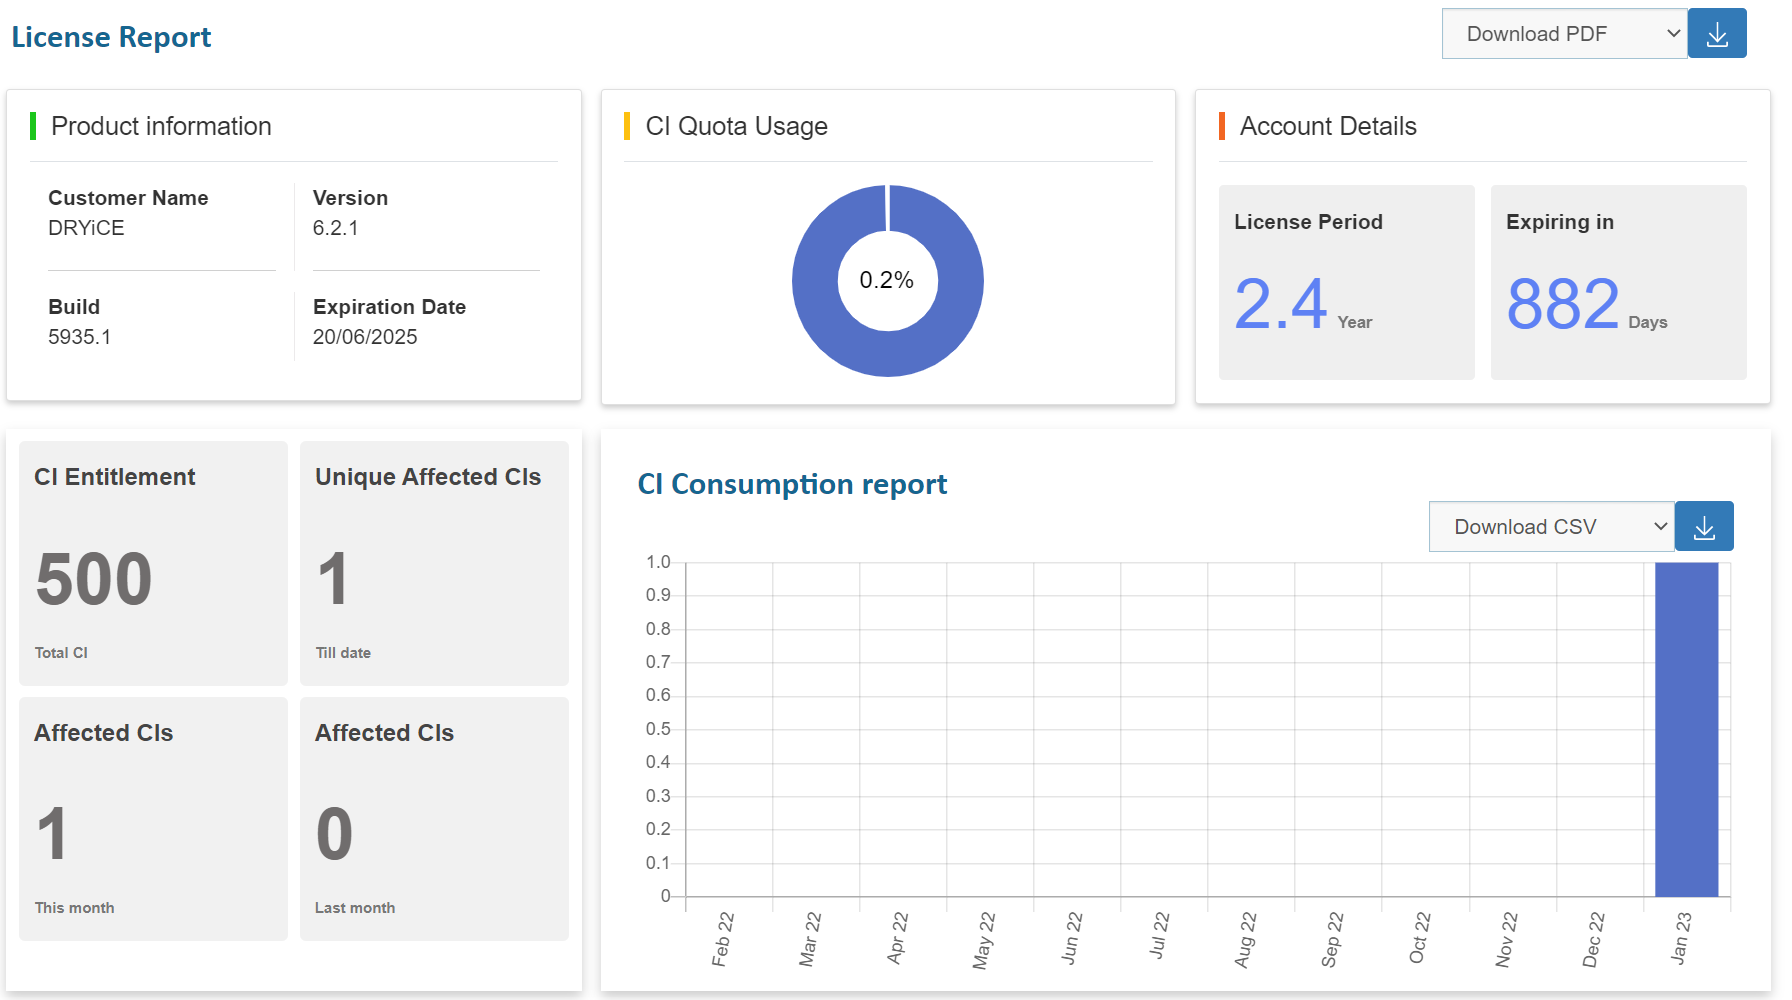
- The page opened shows the below data:
- Product Information: It displays the Customer Name, the current version of the product, build version and license expiry date.
- CI quota usage: It displays the % of CIs that have been utilized by the system.
- Account Details: It displays the period of license and the no. of days left for expiration.
- CI Entitlement: It displays the total CI count present in the system, no. of unique affected Cis till date, no. of affected Cis for current month and no. of affected Cis for last month.
- CI Consumption Report: It displays the graphical representation of the CIs consumed over the last one year. User can download the CSV report for this graphical data.
- User can also download the data in pdf format using the
‘Download PDF’ option.
My Favorites
There is another option to add a menu into favorites tab. For all the menus that are frequently required can be added in favorites menu so that they can be easily accessed from this menu. For that, click on icon
 corresponding to any menu.
Figure 25. Figure - Add Favorite 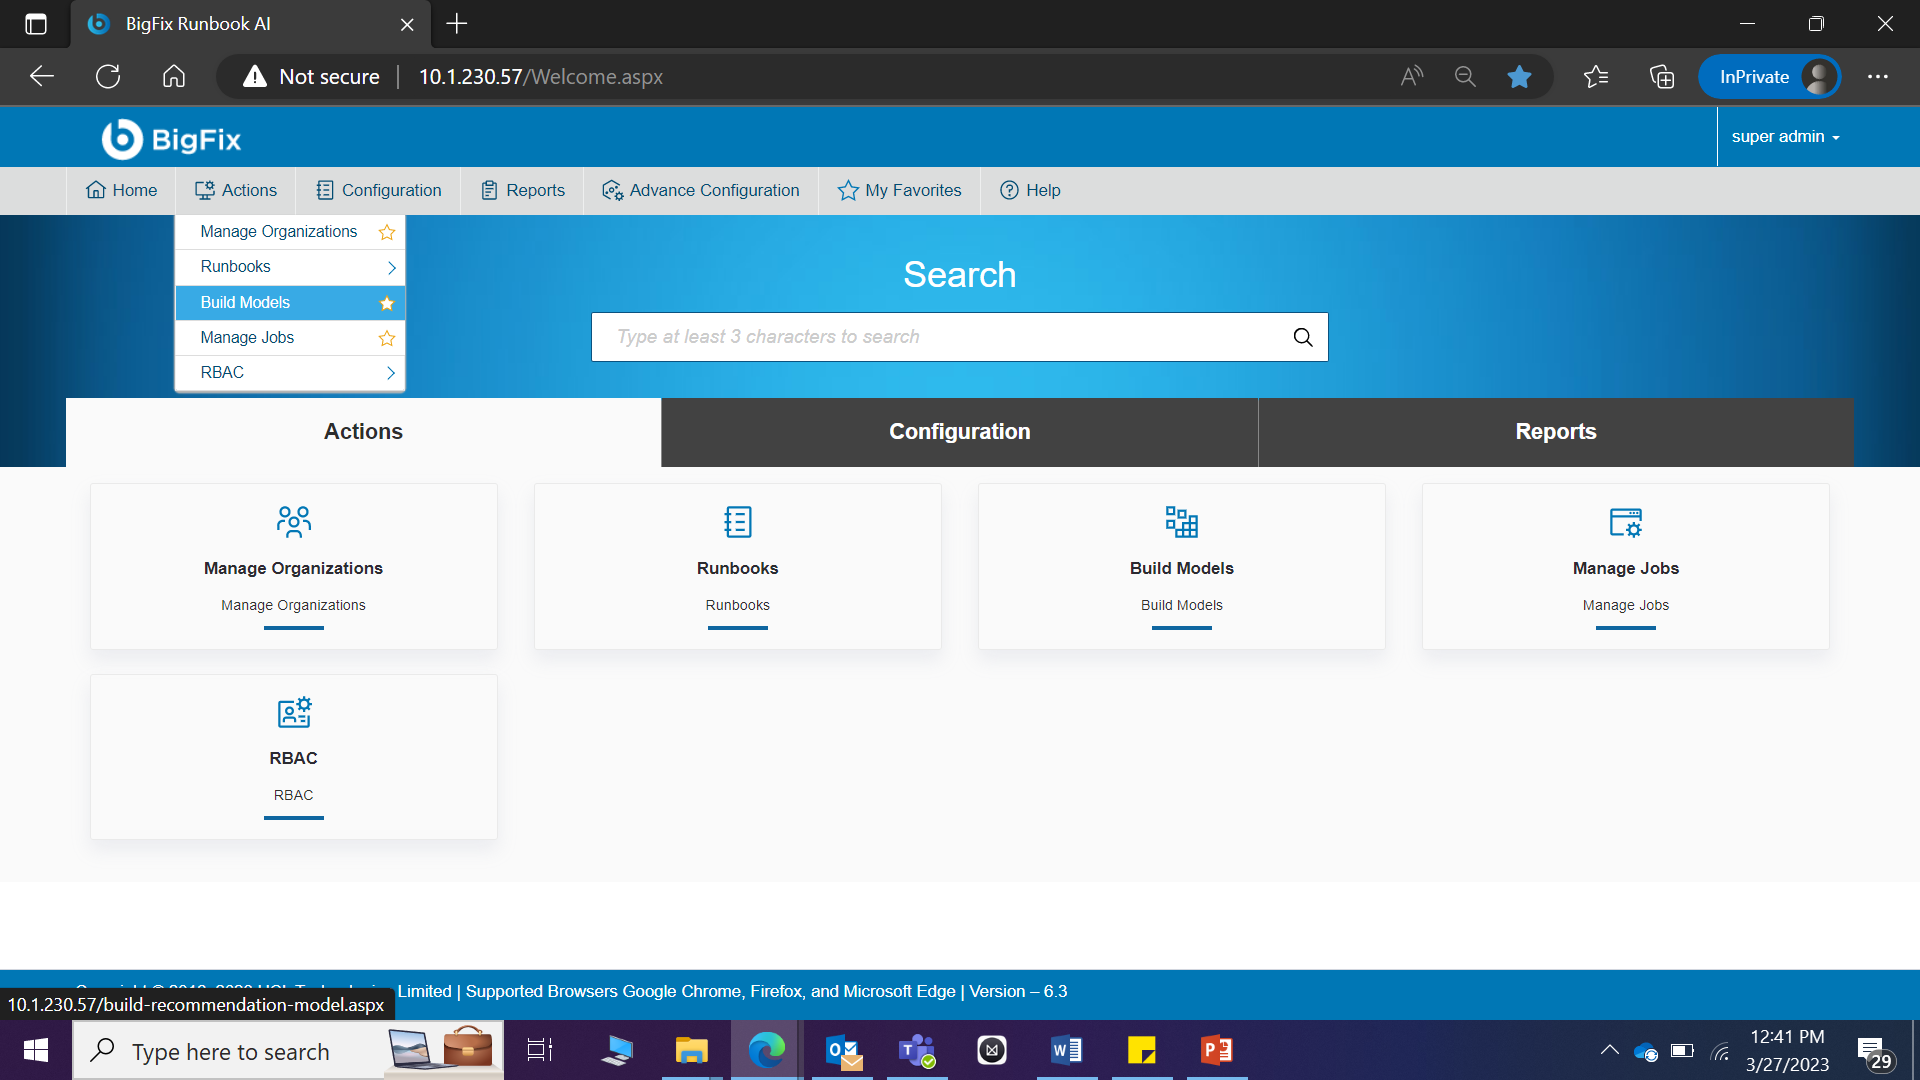
The menu will then be added to My Favorites menu from where menus can be directly access without looking for them under menus.
Figure 26. Figure - Add Favorite (cont.)