CyberFOCUS Analytics dashboard
From the BigFix CyberFOCUS Analytics dashboard, you can view various reports that display critical information related to vulnerabilities. The data are represented in the form of graphs and tables, so that the user can quickly become aware of the IT assets and the threats in the environment and take informed decisions to mitigate vulnerabilities.
The dashboard consists of the following analytic reports:
With the help of these reports, IT Admins and Security Admins can quickly ascertain the list of vulnerabilities, content to be patched, and the list of machines that need patching.
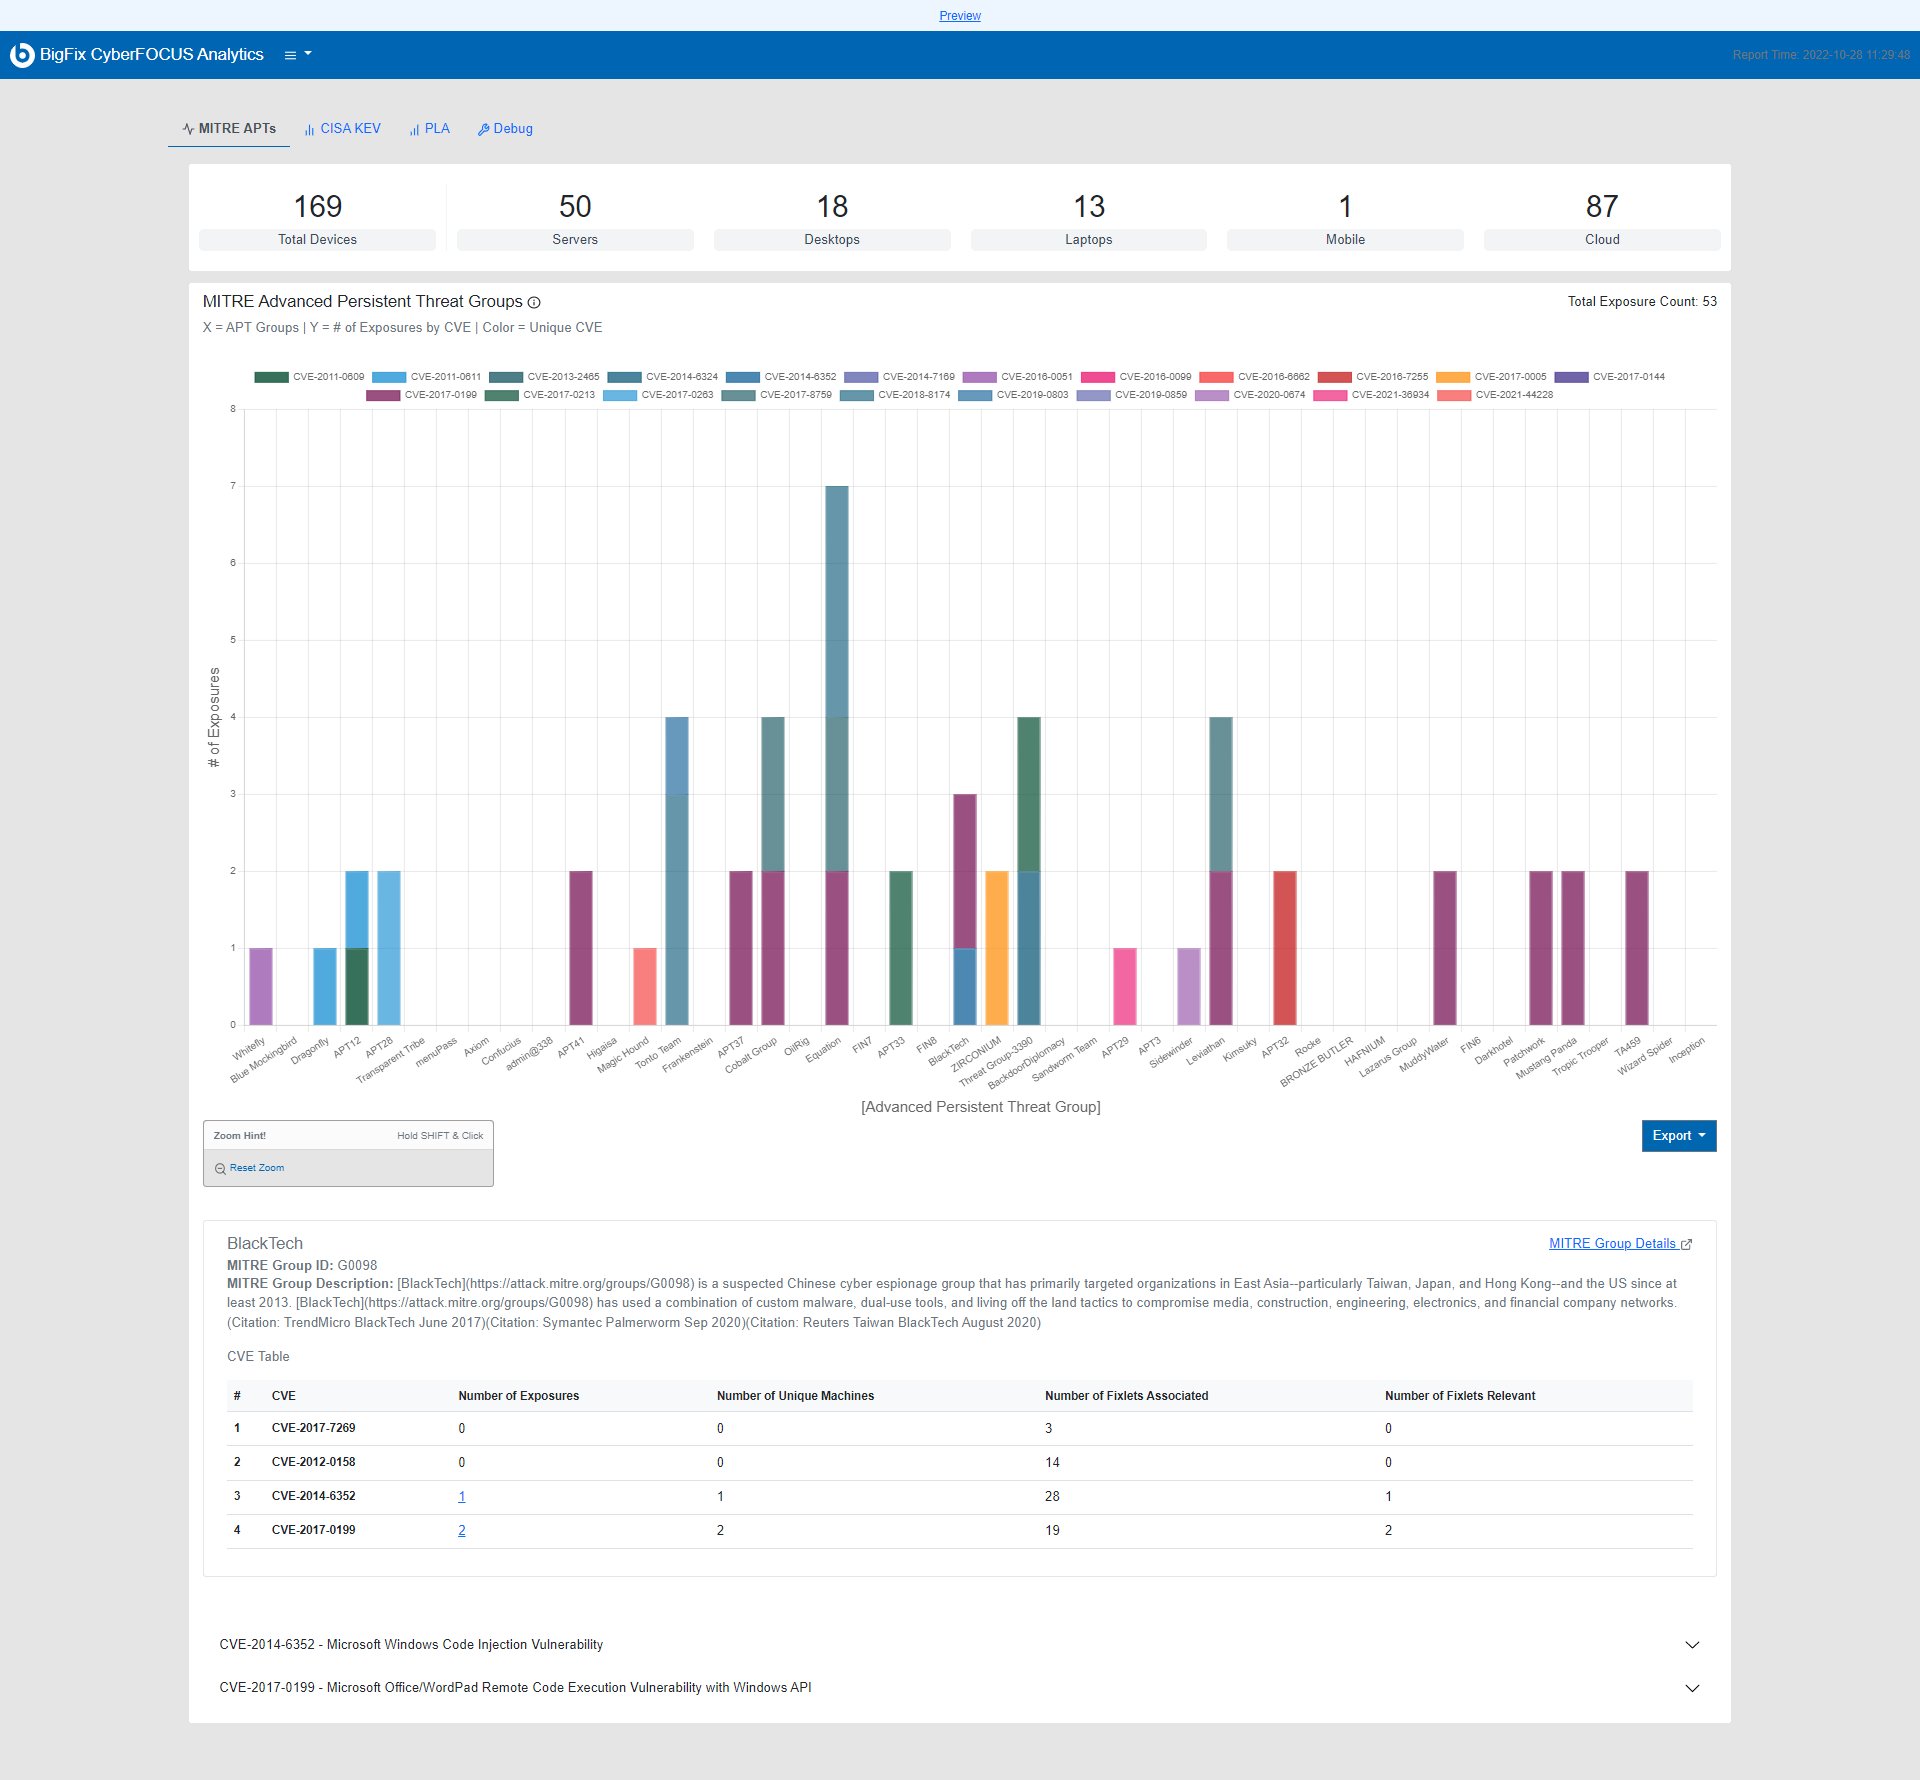
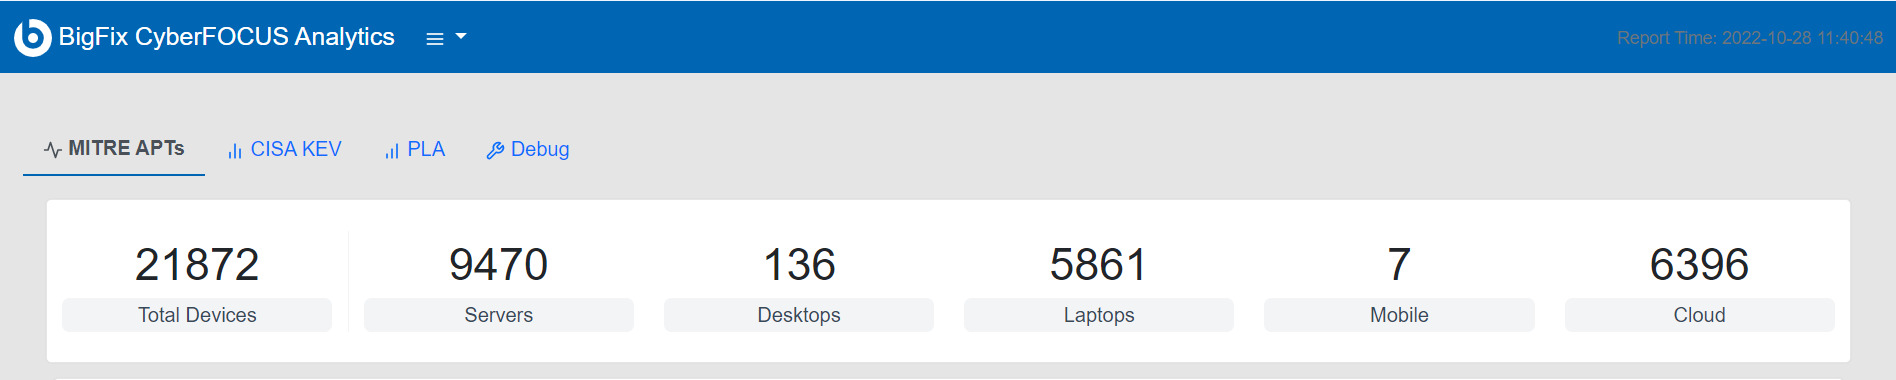
Device count
Mouse interactions
- Hover over an element in the graph to view more information specific to the CVE associated with that element and applicable environment details below the chart.
- Click on any number with a link to view more information such as CVE details, Fixlet details, and content as applicable.
- Click on a text link to redirect to the external link with more information specific to that report.
- Click expand
 or
collapse
or
collapse  to view or
hide the content details related to the CVE.
to view or
hide the content details related to the CVE.
Zoom
You can zoom in or zoom out the graph to focus on the data as needed.
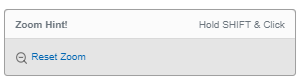
- To zoom the chart, press shift key and click the mouse on the desired area and drag.
- To reset zoom, click the link Reset zoom aligned under the bottom left corner of the graph.
Export data
You can export the data of the MITRE APTs and CISA KEV reports in
a .csv format.
- Export CVE: Exports the source data of the chart.
- Export content: Exports the content related to the CVEs.
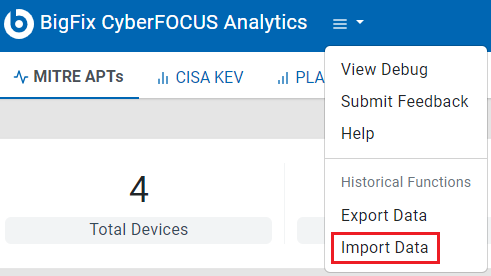
Import data
The feature enables the import of past data and review reports from a historical perspective. This allows users to assess whether the deployment was an improvement or a regression.
To import the data, click ![]() and select Import data from Historical
Functions.
and select Import data from Historical
Functions.
Device Drilldown
The Device Drilldown feature enables the user to focus on specific devices and gather information on CVEs by drilling down into multiple fixlets. The list of devices in the Drilldown tab is expanded as additional fixlets are selected, and the results remain available for analysis and further action.
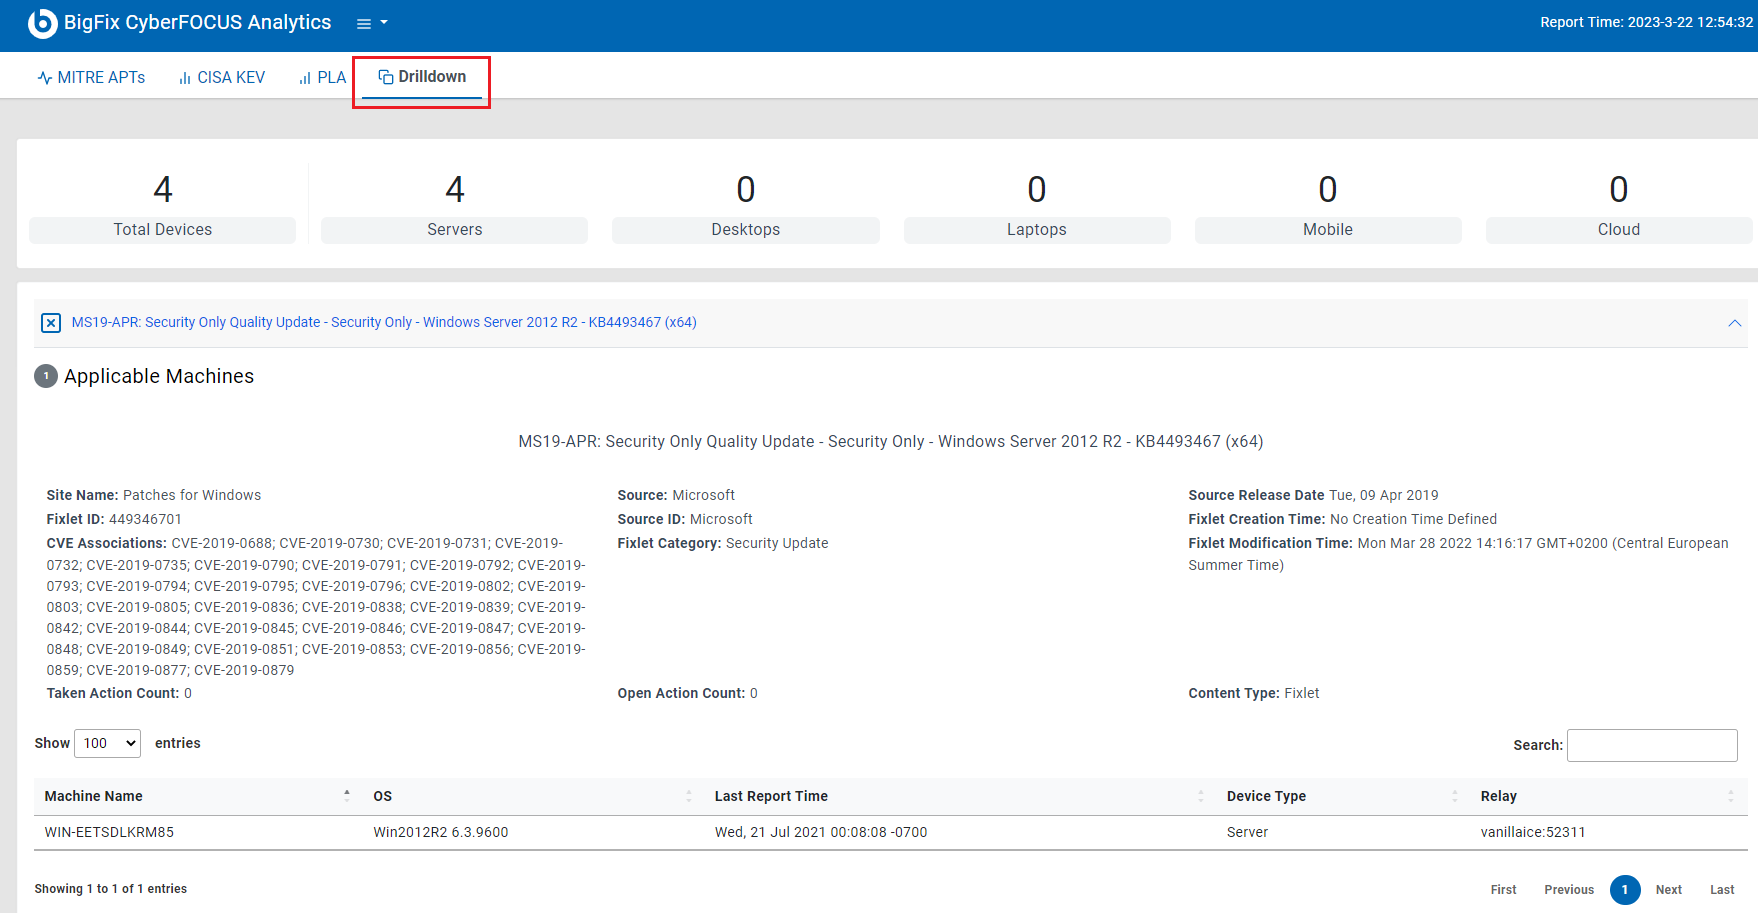
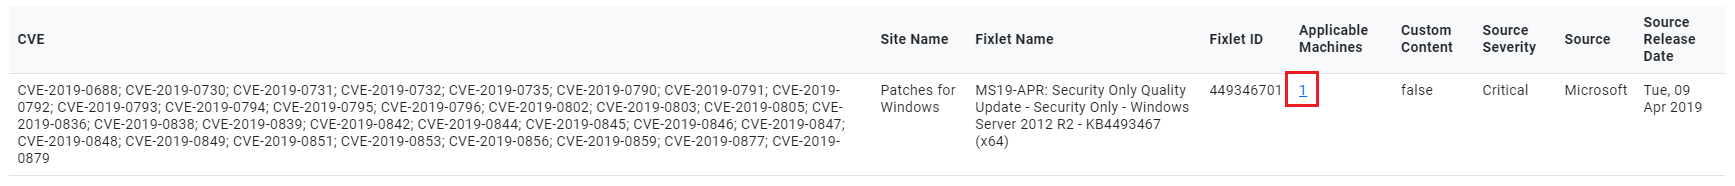
To enable Drilldown tab, in the MITRE or CISA KEV chart, click on the relevant Applicable Machines number in the CVE Table.
Debug
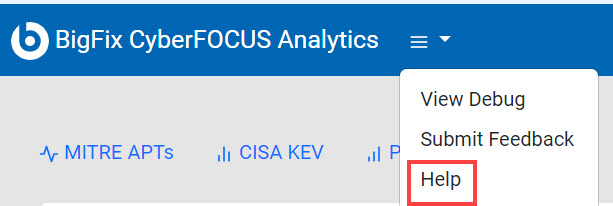
- To view the debug log, click
 and select
View Debug.
and select
View Debug. 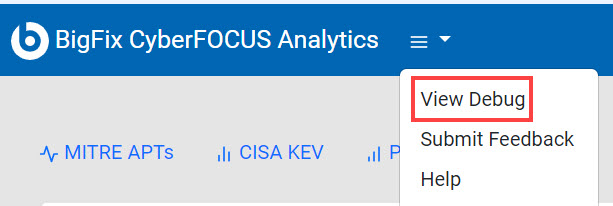
- To download the log as an html file, click the Download Logs link at the bottom left corner of the page.
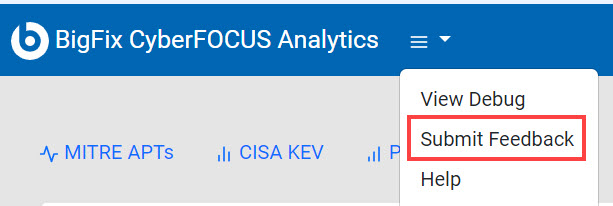
Submit Feedback
You can mail your feedbacks and suggestions about BigFix CyberFOCUS to HCL.
Help
From the report, to get more information about BigFix CyberFOCUS, you can visit the documentation page.