Monitoring
Purpose
HCL Unica Director Monitoring feature provides a view of flowcharts executions and their detailed information of flowcharts created by all users. It is accessed by clicking on the ‘Monitoring’ option in the left menu bar. Monitoring option is available only for Campaign application
Monitoring Dashboard
Unica Director displays execution highlight information along with timelines. This includes
- Number of successfully executed flowcharts (Status as finish)
- Number of running flowcharts (status as Started / Continue)
- Number of failed flowcharts (status as failure)
- Number of stopped flowcharts (status as stopped)
- Number of paused flowcharts (status as paused)
- Number of current flowchart runs taking longer than average execution time
Unica Director provides user capability to see flowchart execution statistics of "Today" (covering the last 24 hours), "Week" (covering the last 7 days) and "Month" (Covering the last 30 days), or for a specific date selected from the provided calendar. The flowchart execution statistics will be shown on the top panel per the selection.
By clicking on flowchart link user will be directed to the flowchart execution details where the process box execution details are available. HCL Unica Director does not show the flowchart information of flowcharts scheduled in the Unica Campaign application. It only shows the flowchart information of the executed flowcharts
Flowcharts executed (completed flowchart run / branch) using Schedule process box are not supported by Unica Director. The user will see the flowchart status as ‘running’ all the time and the detailed process execution displays the same process boxes executed repeatedly
Unica Campaign publishes the flowchart information to Unica Director using Message Queue. Data is pushed from Unica Campaign to Message Queue and consumed and flowchart information stored, Unica Director. Message Queue should be up and running all the time to publish the data to Operational Dashboard. In case Message Queue is not up then flowchart execution data will not be available in Unica Director
Flowcharts
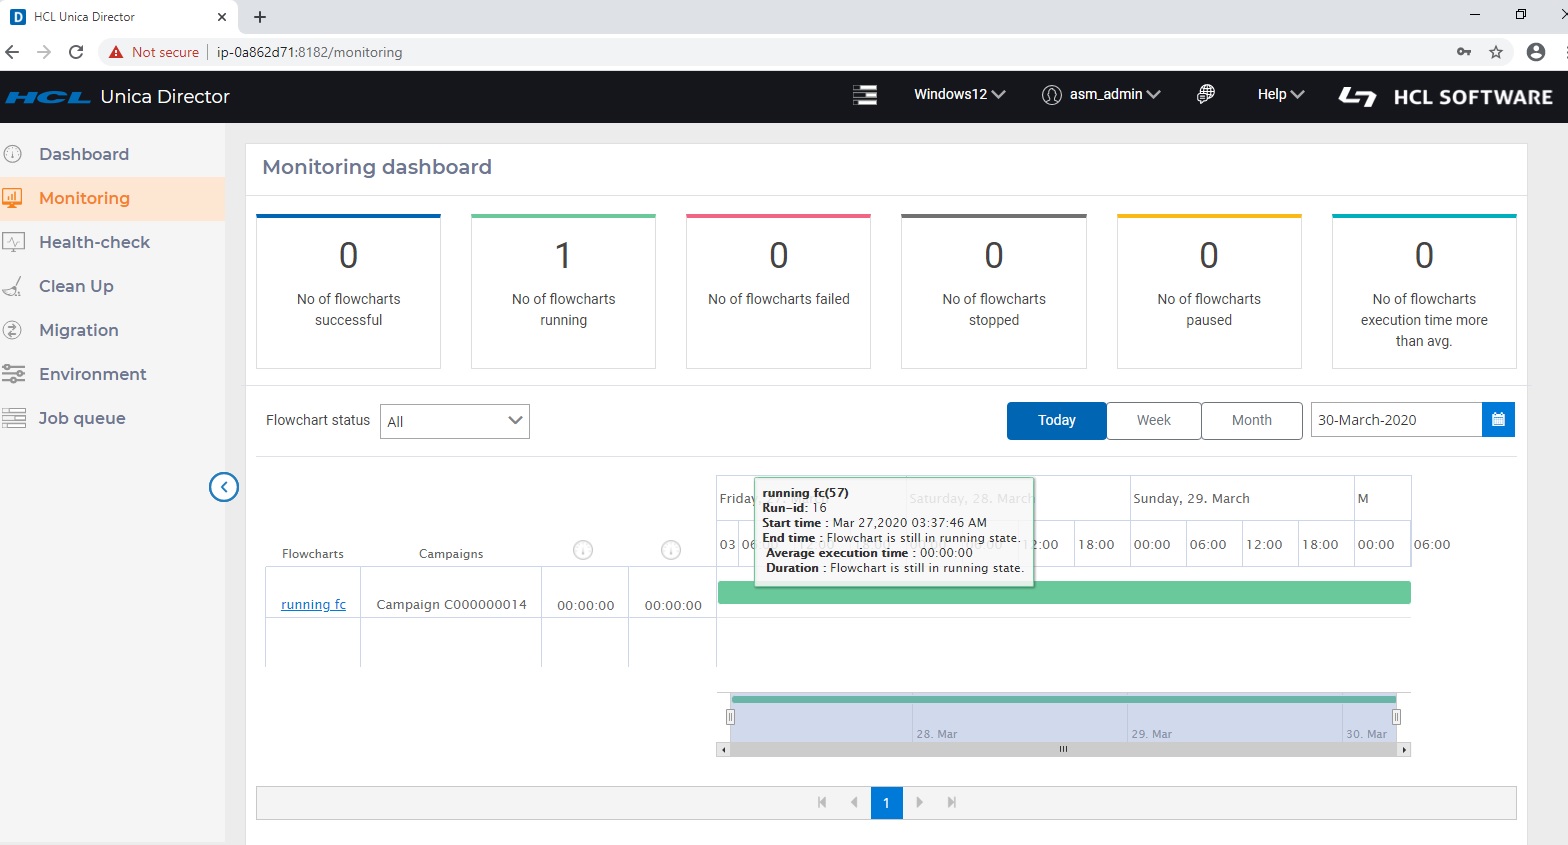
Mouse hover over the timeline bar of a particular flowchart, displays flowchart details including
- flowchart execution start time, end time and average flowchart execution time
- The duration of the latest flowchart execution
Flowchart states and valid actions
The following table describes the valid flowchart states, colour and the actions that are available on the Monitoring dashboard page.
The flowchart status reflects the status of the last run.
| Status (color) | Description |
| Running (green) | The flowchart is running |
| Paused (Yellow) |
The flowchart run was Paused intentionally.
|
| Succeeded (Light Blue) | The flowchart run completed successfully, without any errors. |
| Stopped (Black) | The flowchart run was stopped intentionally or due to an error or due to an error in one or more process boxes |
| Failed (Red) | The run failed due an unhandled error or a server error indicating that the flowchart server process exited unexpectedly |
| Number of flowcharts exceeding current average execution time |
Flowchart average execution time is calculated as the average of execution times of successfully completed flowcharts.
|
Process Box Details
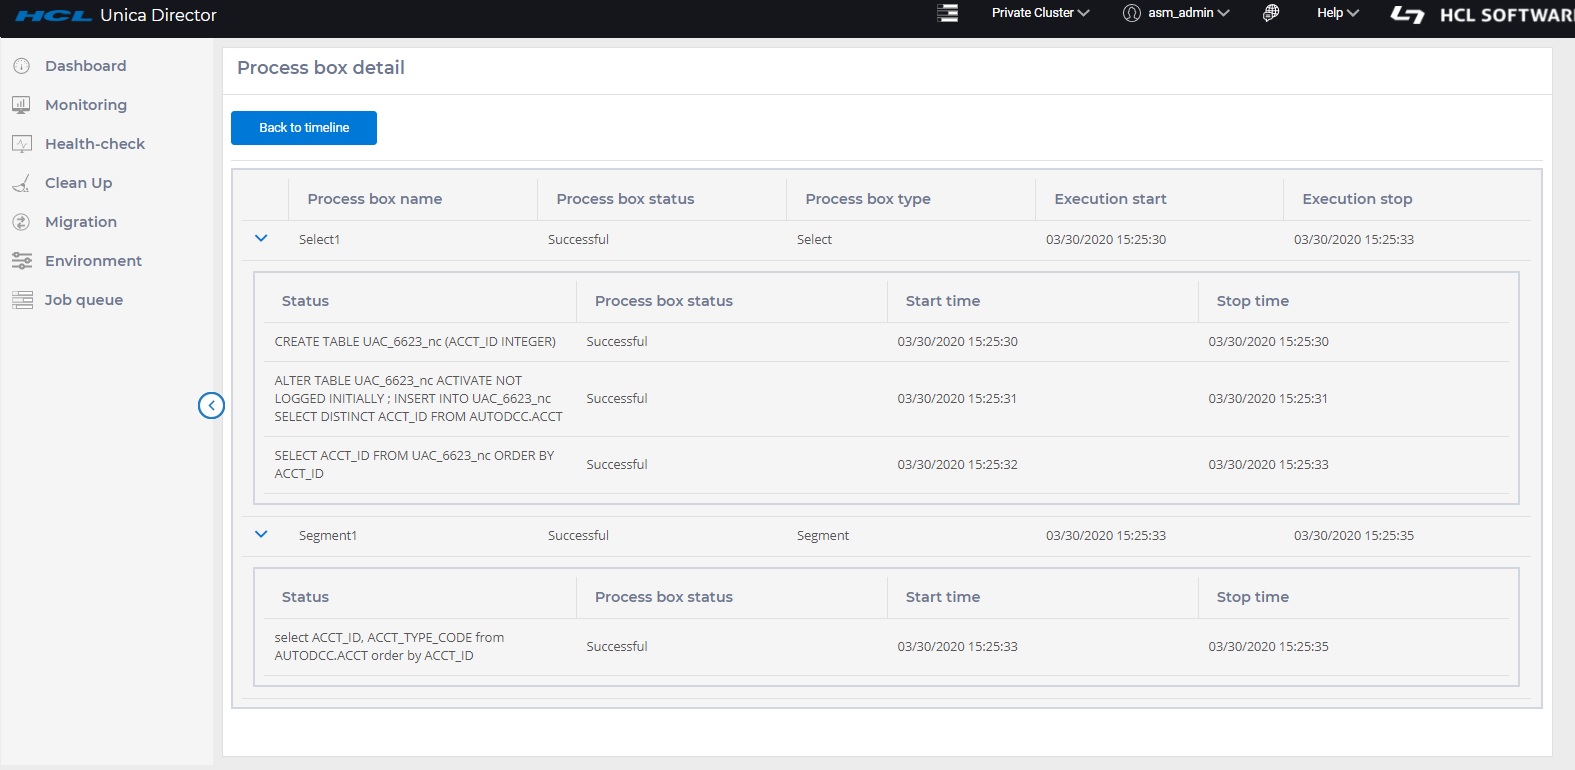
- Clicking on a flowchart in the previous screen navigates to the flowchart listing page. The information displayed on this page includes
- Process box name, status and type
- process box execution time
- start time and end time
- process box status
- status of queries executed and time taken by each query
Unica Director does not show the information of flowcharts scheduled in the Unica Campaign application. It only shows the flowchart information of the executed flowcharts.
Flowchart status:
The user can select any of the following Flowchart status options per the selection of "Today", "Month" and "Week" or selected date and Flowchart status – Flowchart execution shown on timeline grid.
- ALL
- Stop
- Running
- Successful
- Paused
- Failed
‘Running’ Flowchart statistics, displayed on top of the flowchart monitoring page, are for all the flowcharts currently in the ‘Running’ state irrespective of "Today", "Month" and "Week" or selected date.
Configuring Unica Director Flowchart Monitoring feature in HCL Marketing Platform
- Choose Settings > Configuration.
- Open the Campaign|FlowchartEvents category and set the properties
- Set enableEvents = Yes.
- Choose Settings > Configuration.
- Open the Campaign|FlowchartEvents|ActiveMQ category and set the properties
- url tcp://<Hostname>:61616
- Platform User with Data Sources for ActiveMQ Credentials asm_admin
- Data Source For ActiveMQ message broker credentials ACTIVEMQ_CRED_DS
- queueName flowchartInfo-campaign
Data Source under Setting ->User
User name = ACTIVEMQ_CRED_DS
Password = admin
For more information, see the Unica Platform Administrator's Guide.