Example: process connections
The way processes are connected in a flowchart determines the flow of data.
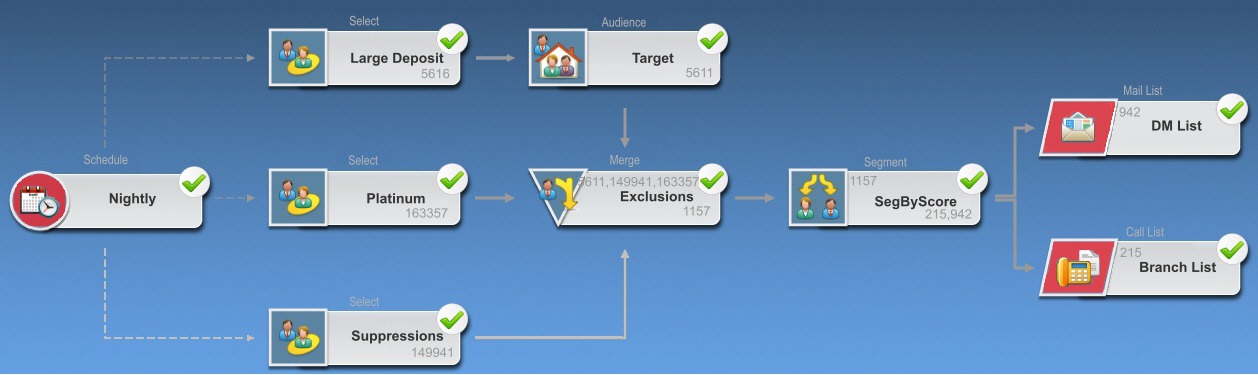
Flowchart scheduled to run every night
When a destination process receives data from a source process, the connection is shown as a solid line. Temporal relationships are shown as dotted lines.
The following flowchart starts with a Schedule process that is configured to run automatically every night. The dotted lines from the Schedule process to the three Select processes indicate a temporal dependency, meaning the Select processes will not run until the Schedule process finishes running. However, no data is passed from the Schedule process to the Select processes.
The solid lines between the other processes show the flow of data. For example, the merged selections flow from the Merge process (labeled "Exclusions") into a Segment process ("SegByScore"). The segmented selections then flow into Mail List and Call List processes, so the offers can be delivered by different channels.