Health Check
Purpose
The HCL Unica Director Health Check screen provides a snapshot of the availability of the various campaign servers in selected environment (only one environment can be monitored at a time). This comprises the database, listener and application server. Health-Check monitors the critical parameters of the different systems.
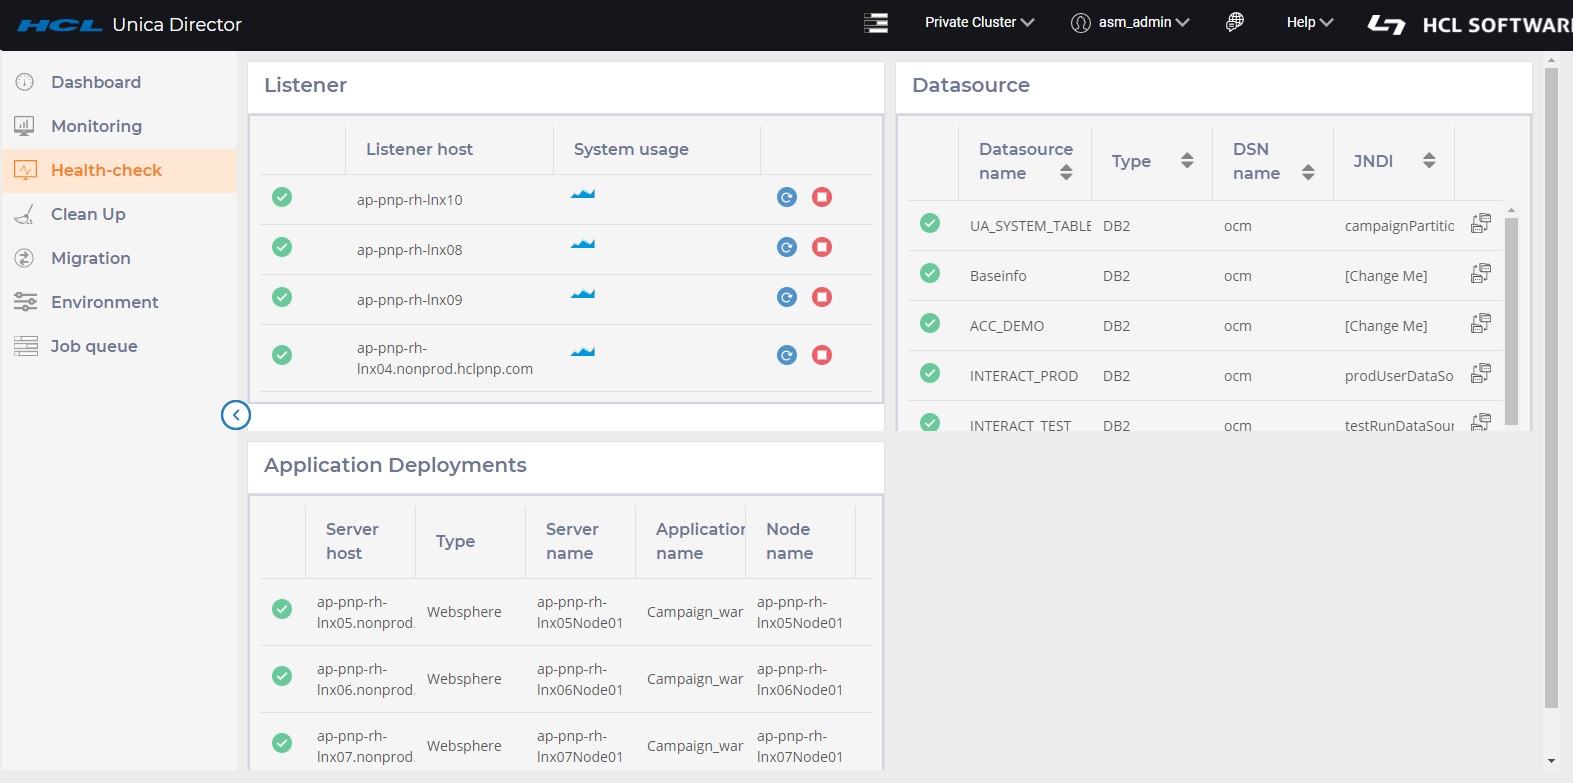
To get to the Health Check screen, from the left menu bar, select ‘Health Check’
Listener health
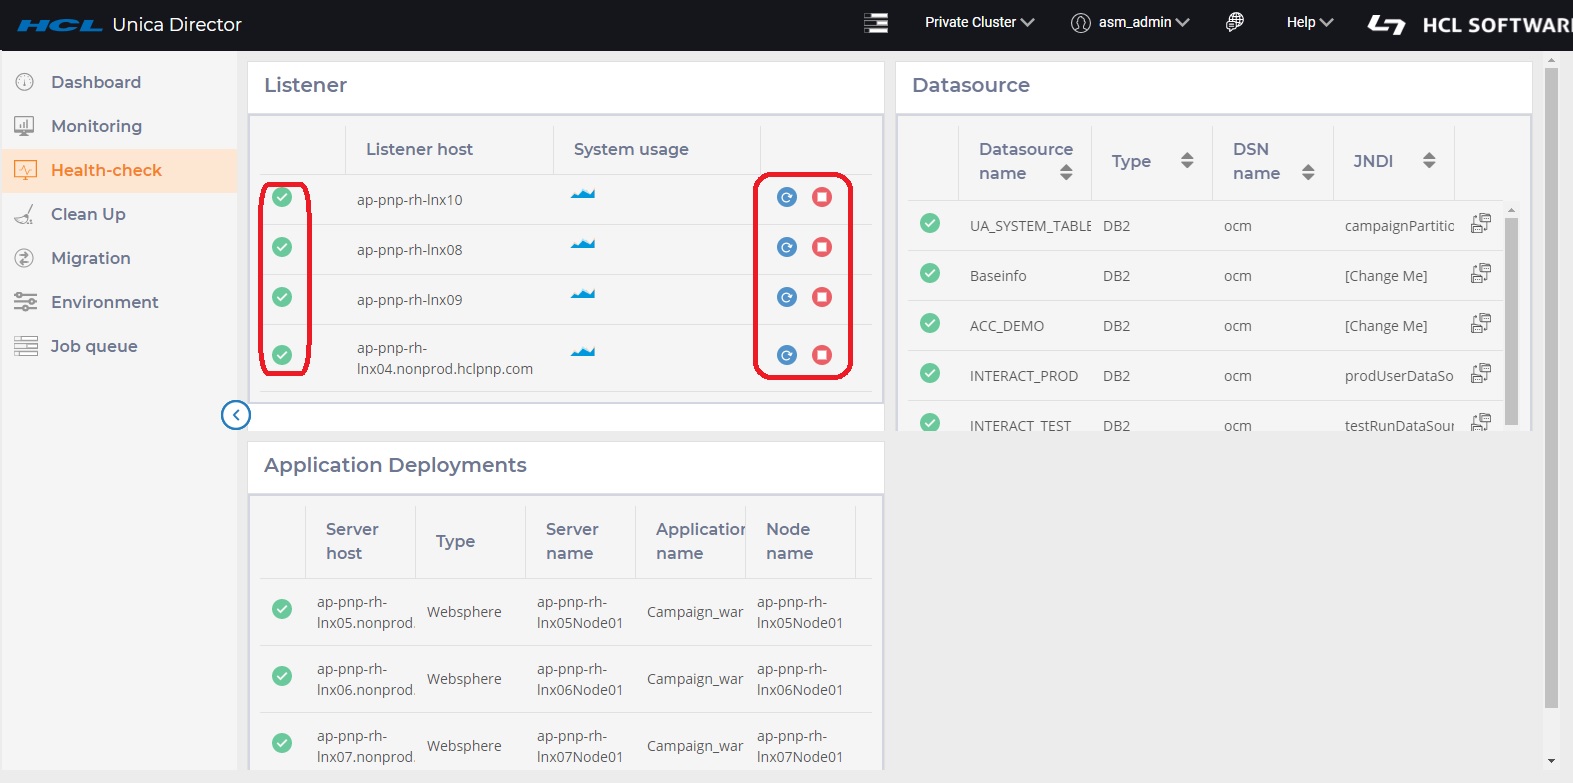
- Availability: started or stopped status.
- Restart, Start or stop the Listener.
Status of listener (started, restarted or stopped) will be reflected in Job Queue page.
- In case of a listener cluster, the status of each listener is shown and user can perform
start and stop listener on any of the listener node
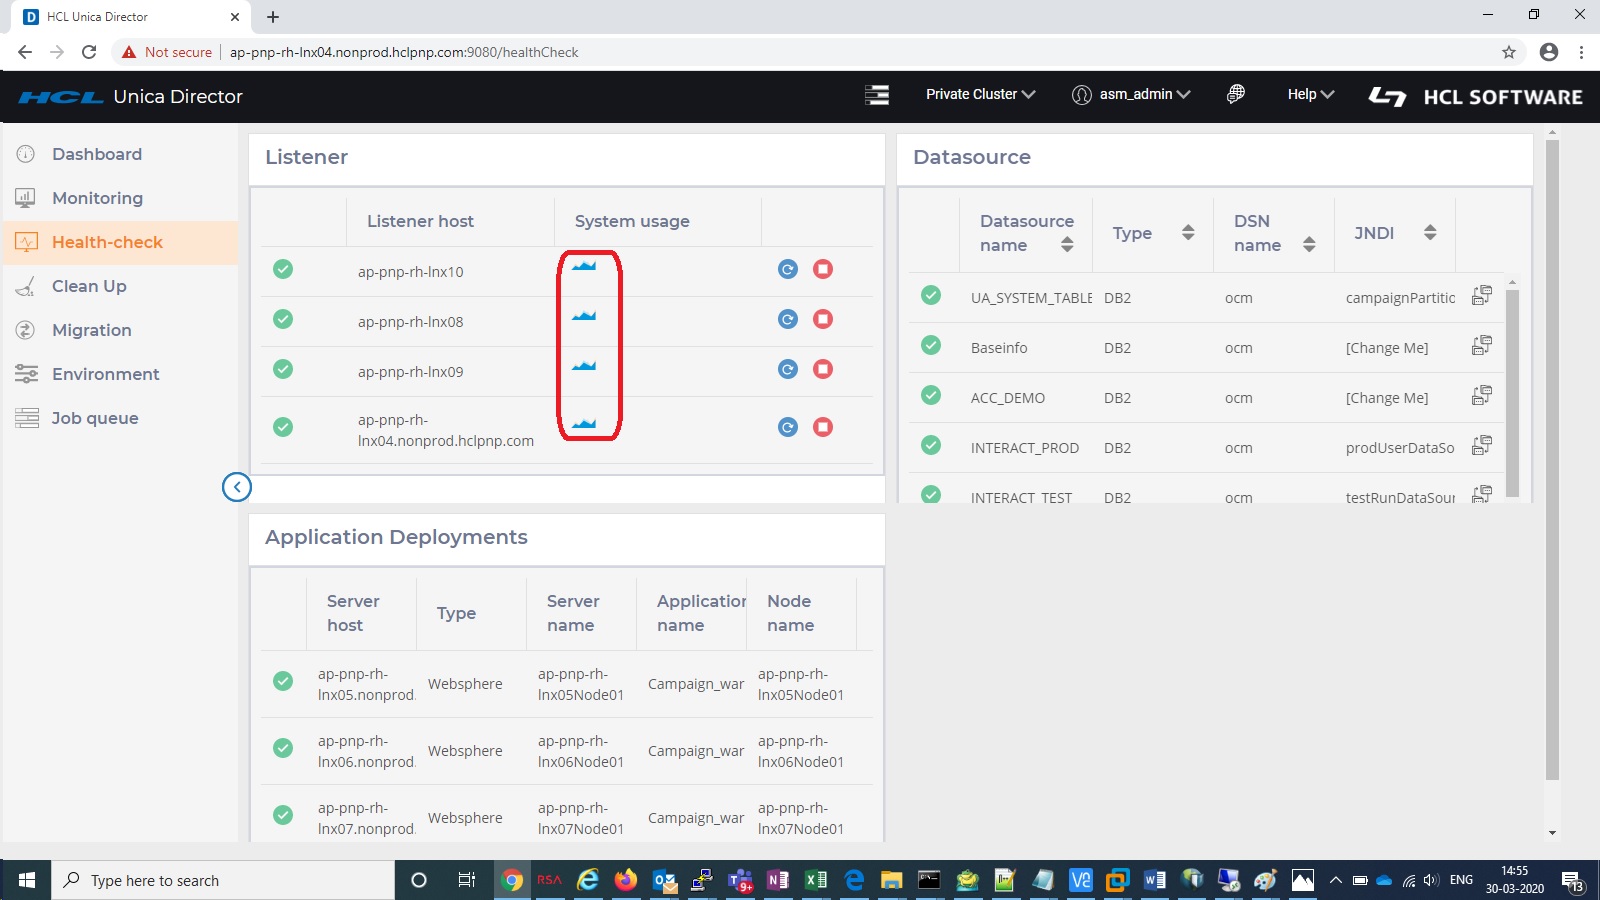
- Listener host system usage: Shows the graph CPU and Resident Set Size (RSS) Memory utilization on Listener and Campaign web application machines for all Operating Systems.
System Usage
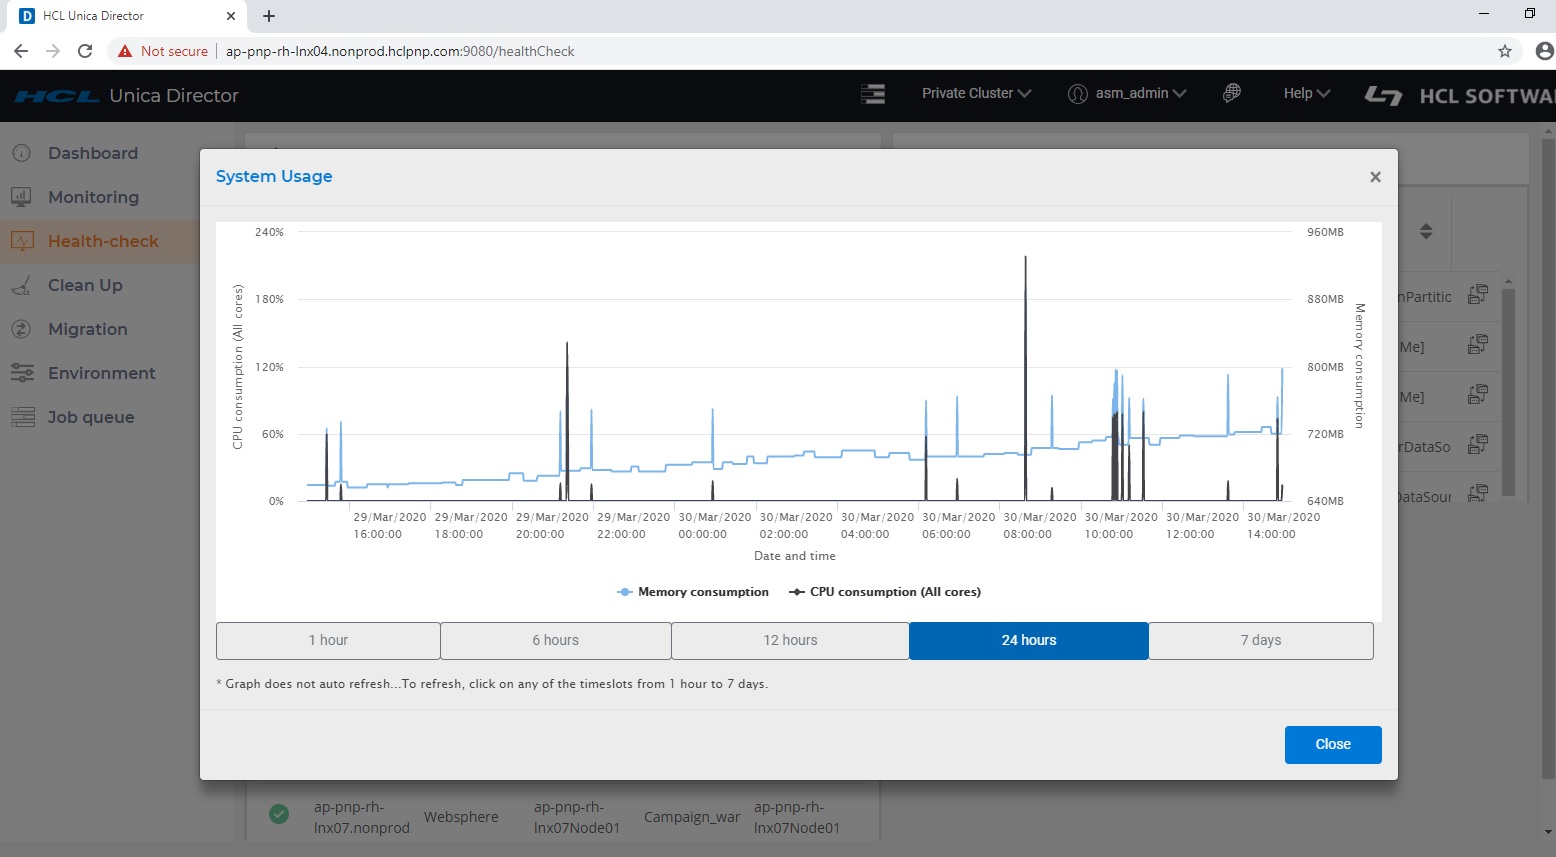
- System usage displays CPU Utilization and Memory Consumption of Campaign Listener and its sub-process for Last 1 hr , 6hrs , 12 hrs , 1 day and 7 days.
- Unica Director shows RSS memory Consumption on health check screen for RHEL Linux / SUSE/ Windows and AIX operating systems.
- CPU utilization is a measure of CPU used by the Campaign Listener (unica_aclsnr) and its sub-process (unica_aolsnr, unica_acsvr).
- Memory Consumption displays memory used by the Campaign Listener (unica_aclsnr) and its sub-process (unica_aolsnr, unica_acsvr).
- System usage has zooming capability to verify the CPU utilization and memory consumption data details. Details can be expanded by dragging the mouse pointer to respective timeline.
- Please use the Reset Zoom option to remove zoom feature from the Graph.
Notes
- Unica Director %CPU Graph can display beyond 100% utilization. The calculation is
%CPU = (Total Threads on all CPUs / Logical CPU cores) * 100
For example, if there are 2 physical CPU each with 2 cores for a total of total 4 core CPU on system and if each core has 2 threads, there are 4*2=8 logical CPU cores. If the CPU is fully utilized on the listener, then Unica Director will show utilization of 8*100 = 800%
- CPU Utilization and Memory Consumption Graph does not auto refresh. To refresh, click any of the time slots from 1 hour to 7 days.
- System Usage page does not show generic message on the page after deselecting both memory utilization and CPU consumption options.
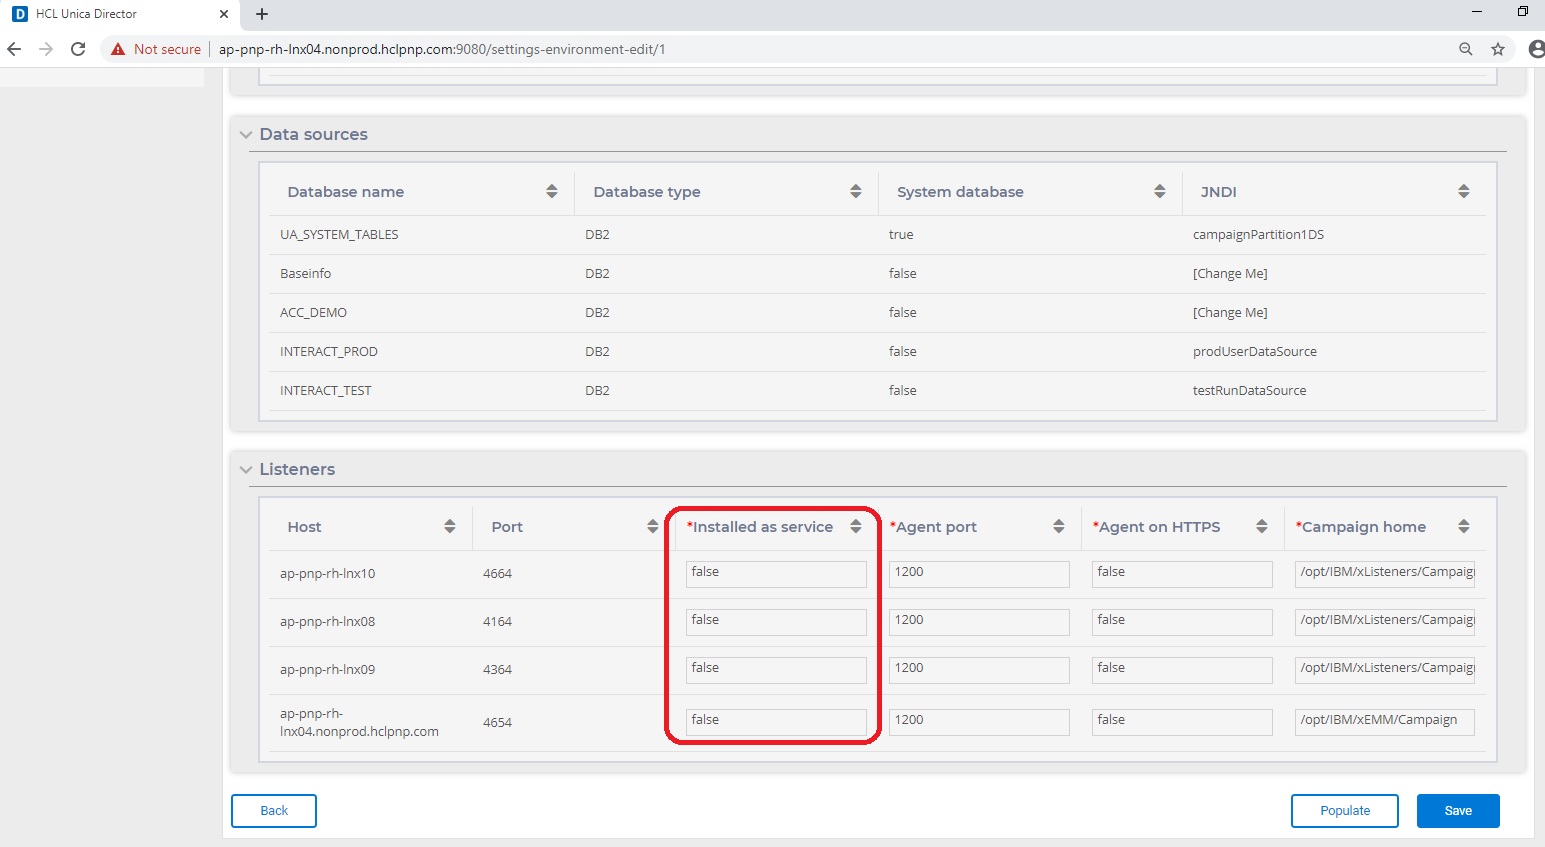
Managing Listener as Service through HCL Unica Director:
- The Listener can be started and stopped through Unica Director is when it is installed as a Windows service, and the start-stop status is reflected on the Services.msc application page
- To use Listener as a service, in the environment details screen (while adding an environment)
follow the steps below
- Set the INSTALLED AS SERVICE option value to True
- Set CAMPAIGN_HOME path in this format (Please ensure that you use "/" not "\")
- CAMPAIGN_HOME=C:/HCL/Unica/CampaignNote: Please note that the above is an example only. You need to set your own appropriate path
- CAMPAIGN_HOME=C:/HCL/Unica/Campaign
- Adding, updating or deleting a listener will not be reflected automatically in environment details in Unica Director. You must delete the current environment from the Environment menu option and add it back so that the latest Listener will be monitored by Unica Director
Data Source
All the data sources from the selected environment are listed
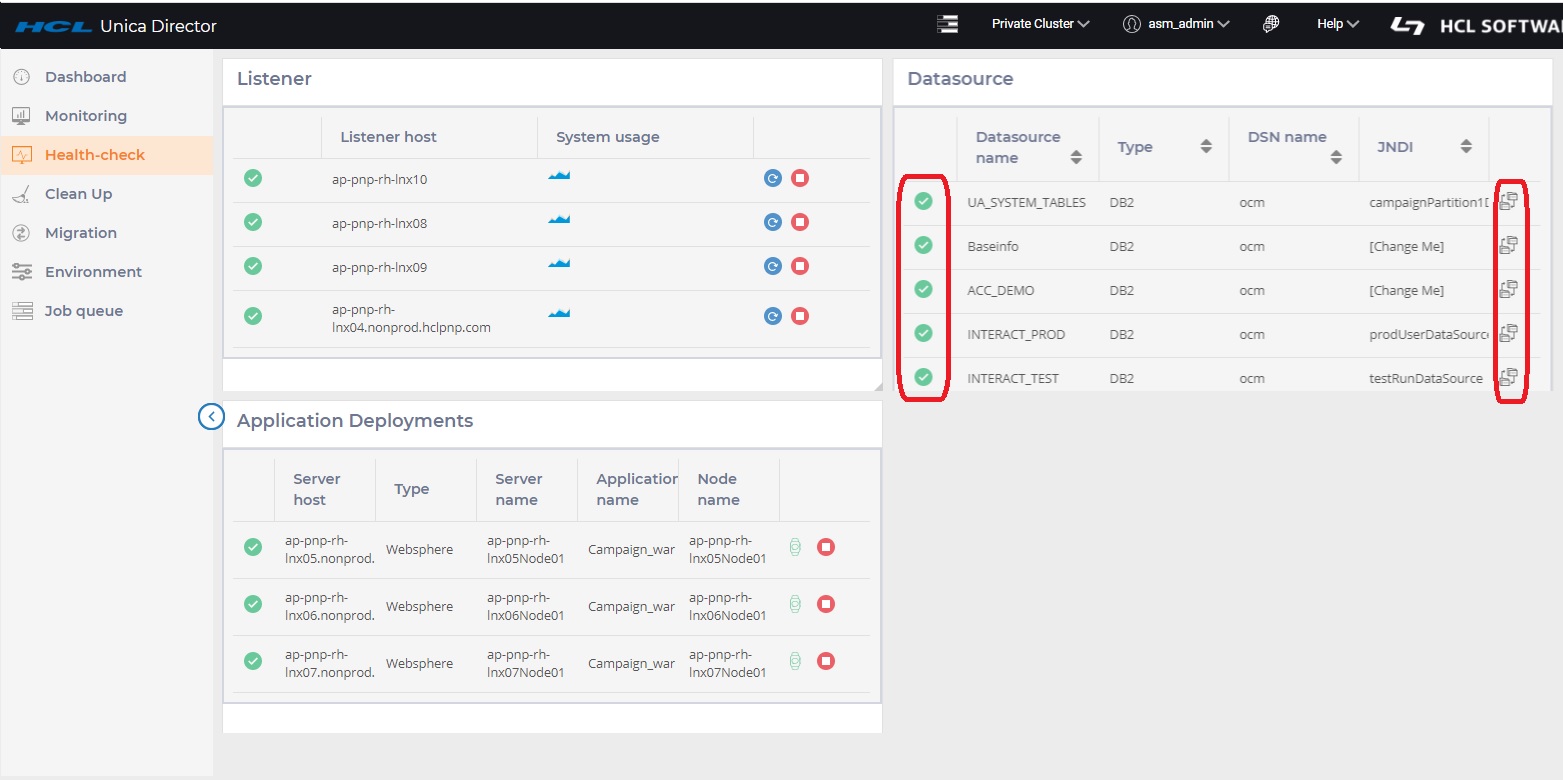
The connectivity of all data sources configured in Platform from all the Campaign Analytical server are tested and displayed Connection failures should be reflected in the logs. You can get the status of your data sources. Start / stop actions are not supported for data sources. All data sources are supported in this connectivity check.
The following columns are listed on the screen:
- Data Source Name
- Type: This is typically the data source template type such as Oracle, DB2, SQL Server, BigDataODBCHive, BigDataODBCImpala
- DSN name: Name of the DSN from the data source
- JNDI: JNDI name
Application Deployments
The Webservers screen provides status of all the webapp servers being monitored and allows you to start and stop the Application
Start/Stop status of the application server will be reflected in Job Queue page.
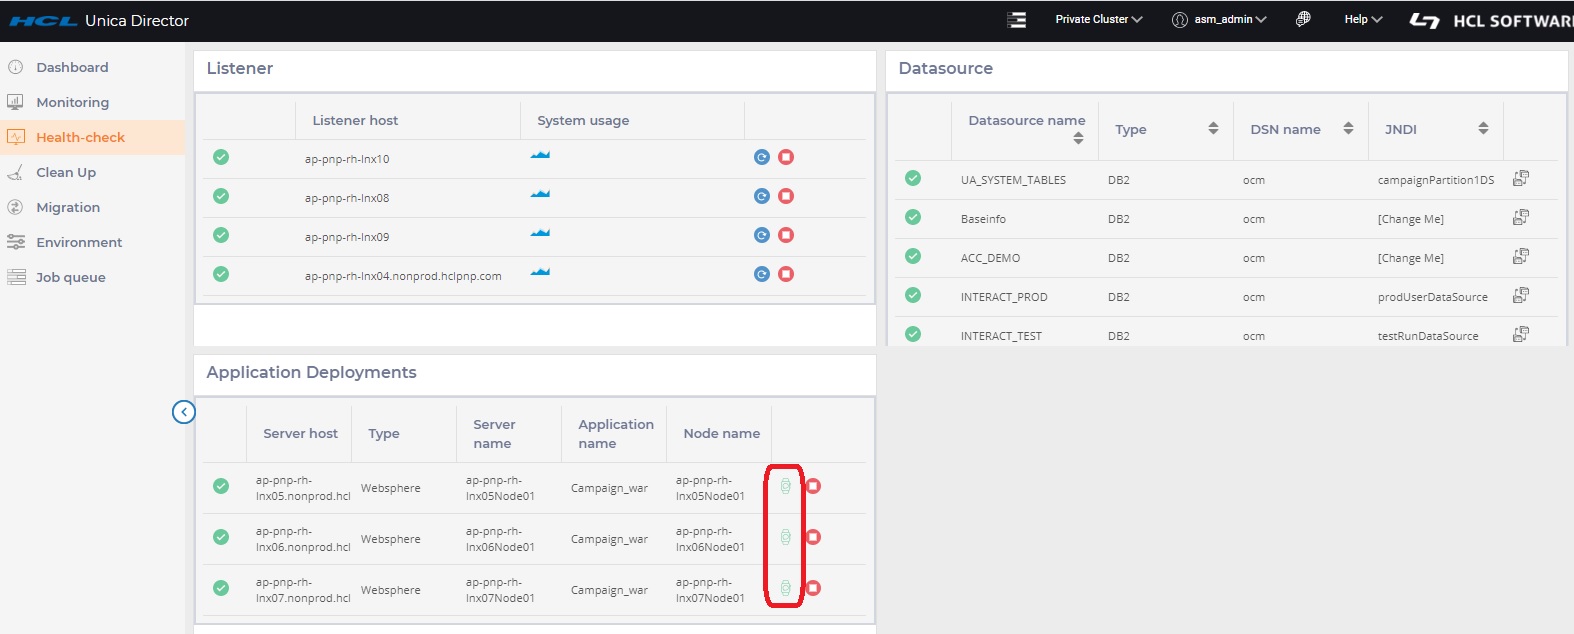
- Server Host - Host name of the machine running the application Server
- Type - Displays the type of the application server (WebSphereWebsphere/Weblogic/Tomcat/JBOSS)
- Application Name - Displays the Node Name of application server – this column displays only the value for Application Server
- Application Deployment Port details:
- Node Name – Displays WebSphereWebsphere application server nodename. e.g. zebra658Node01. Applicable to WebSphereWebsphere only
- Console Port –Displays Port number used by Weblogic console. Applicable to Weblogic only
- JMX Port – Displays JMX port for Tomcat. Applicable for Tomcat only
- Admin Port – Displays Management HTTP/console port for JBoss. Applicable for JBoss only
- Actions : Start / Stop / Get Application Status
- Start and Stop action are updated in Job Queue
- Get Application Status updates the status icon with time stamp
Stop/Start operations on WAS, Tomcat and JBoss cluster
-
Only Stop operation for Campaign Application is not supported for Websphere or Tomcat Cluster from Unica Director. If the user stops Campaign from any of the nodes, Campaign will not be available. If for any reason you need to keep the application down on any node, we strongly recommend that you bring the JVM down along with Campaign on that node.
-
Both Start and Stop operation for Campaign Application are not supported for JBoss Cluster from Unica Director
Start operation on Websphere
-
If Campaign has already started via the webserver Console, starting it again from Unica Director will not change the status icon to ‘Running’ for Websphere.
Supported Application Servers:
- Oracle Weblogic - only standalone deployment
- IBM Websphere Application Server - Standalone and Cluster deployment
- Tomcat - standalone and cluster deployment
- JBOSS - standalone deployment
- On clicking any of the action buttons (start / stop / get Status), you are prompted with a popup to
enter your login credentials (userid / password) of the application server profile. On a successful
login the respective actions will be carried out.Note: For the WebLogic Application Server: Start and stop operations are not supported. You can only see the status information of the Application Deployment.
- Application Server status is not reflected for the first time when the application server node is added in the environment. Click on Get Status icon to get the latest status of Campaign Application.
- For clustered application servers, you should add each application server node in the environment.
- Getting the status and Start/stop actions can only be performed on Campaign application deployments. These cannot be performed on the application server profile.
- Add the following JMX parameter for TOMCAT in the tomcat setenv script:
For Tomcat add the following entry in the setenv script:
– CATALINA_OPTS=-Dcom.sun.management.jmxremote
-Dcom.sun.management.jmxremote.port=5621
-Dcom.sun.management.jmxremote.ssl=false
-Dcom.sun.management.jmxremote.authenticate=true
-Dcom.sun.management.jmxremote.password.file=../conf/
jmxremote.password -Dcom.sun.management.jmxremote.access.file=../conf/jmxremote.access
- jmxremote.password: It should provide the username and password for the tomcat user, this file allows access to only the user that runs the Director agent and restricts access to all other users
- jmxremote.access: It should provide the access roles for the tomcat users. Standard users should be provided with access required to get statuses - like readonly and readwrite
Technical details:
- For WebSphere application server we are using wsadmin tool to get the status of the application server node.
- For WebLogic, we are using wlst script to get the status of the application server.
- For TOMCAT, we are using JMX to connect to the application server.
- For JBOSS we are using JBOSS CLI to get the application status and start / stop actions.
- When the application is configured with ssl you are required to add the following options (Weblogic AppServer only):
-Dweblogic.security.SSL.ignoreHostnameVerification=true
-DwebLogic.nodemanager.sslHostNameVerificationEnabled=false