Dashboard
HCL Unica Director default screen after logging on, is the Dashboard. It can also be accessed by clicking on the ‘Dashboard’ option of the left menu bar.
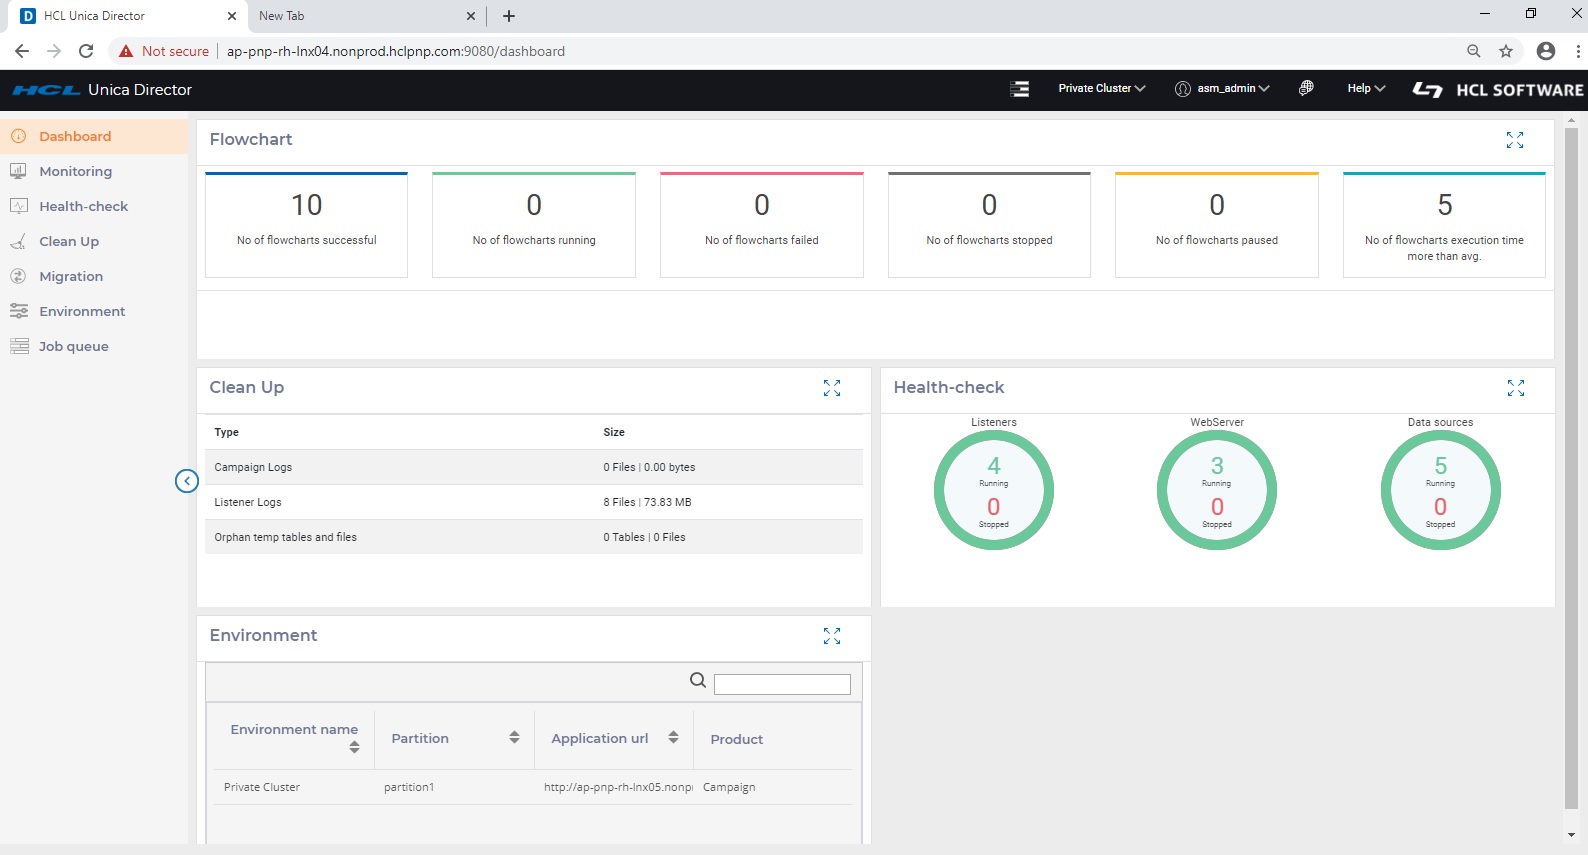
HCL Unica Director provides a dashboard view of the information available in Unica Director comprising
- The status and statistics of flowcharts
- Display of Campaign logs, Listener logs and Orphan temp tables and files
- Health-check of Listeners, Web Servers and Data Sources,
- Environment related data such as Environment name, Partition, Application URL and the Product. Note: Scrolling down may be required to reach this section
Flowchart Monitoring
- Flowchart statistics are displayed in the top section of the dashboard page and are calculated per the flowcharts which are executed (passed/failed/stopped/paused today.
- Flowchart timeline top level information is displayed per the current / latest status of the flowchart on Current date. Flowchart monitoring pane displays the flowcharts per the start date and time, and not per the completion time of these flowcharts
- While any flowchart is still in ‘running’ status and started before ‘today’ it will get displayed in Today's timeline.
- Any flowchart with any of these statuses - stopped/ failed/paused - which was started before today will not be displayed in today's timeline. These will be available in timeline with date same as their start time.