Graph-tool metrics menu

The Metrics menu contains options for choosing the class of metrics to display in the graph tool.

Metrics are organized by class and scope. When you select a metric for the graph tool to display, you must specify the metric class, the metric scope, and the name of the metric.

The metric class is the generic database server component or activity that the metric monitors. The metric scope depends on the metric class. In some cases, the metric scope indicates a particular component or activity. In other cases, the scope indicates all activities of a given type across an instance of the database server.

The Metrics menu has a separate option for each class of metrics. For more information about metrics, see Why you might want to use onperf.
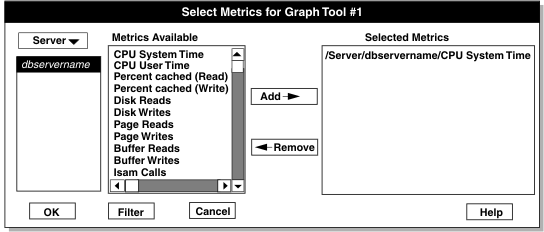
When you choose a class, such as Server, you see a dialog box like the one in The Select Metrics dialog box.
Figure 1: The Select Metrics dialog box

This figure is an illustration of the Select Metric Dialog Box.

The Select Metrics dialog box contains three list boxes. The list box on the left displays the valid scope levels for the selected metrics class. For example, when the scope is set to Server, the list box displays the dbservername of the database server instance that is being monitored. When you select a scope from this list, onperf displays the individual metrics that are available within that scope in the middle list box. You can select one or more individual metrics from this list and add them to the display by clicking Add. To remove them from the display, click Remove.
Tip: You can display metrics from more than one class in a single graph-tool window. For example, you might first select ISAM Calls, Opens, and Starts from the Server class. When you choose the Option menu in the same dialog box, you can select another metric class without exiting the dialog box. For example, you might select the Chunks metric class and add the Operations, Reads, and Writes metrics to the display.

The Filter button in the dialog box brings up an additional dialog box in which you can filter long text strings shown in the Metrics dialog box. The Filter dialog box also lets you select tables or fragments for which metrics are not currently displayed.

After you make your selections, you can click OK to proceed, or Cancel if you choose not to proceed.