Raw utilization of license metrics
Available from 9.2.1. Raw data about utilization of license metrics is collected for products that deliver .slmtag files and is shown on the Resource Utilization report. The data that is shown on the report is not aggregated. It means that if a product can use five license metrics, five rows are shown on the report for that product. What is more, all metrics that are available for a product are displayed, not only metrics that are defined by your license agreement.
To collect raw utilization data, run the resource utilization scan. The scan is scheduled automatically if you enabled the default scan configuration. Otherwise, enable it manually. For more information, see: Initiating software scans.
For the list of IBM products that deliver .slmtag files, see: Resource Utilization Measurement Community.

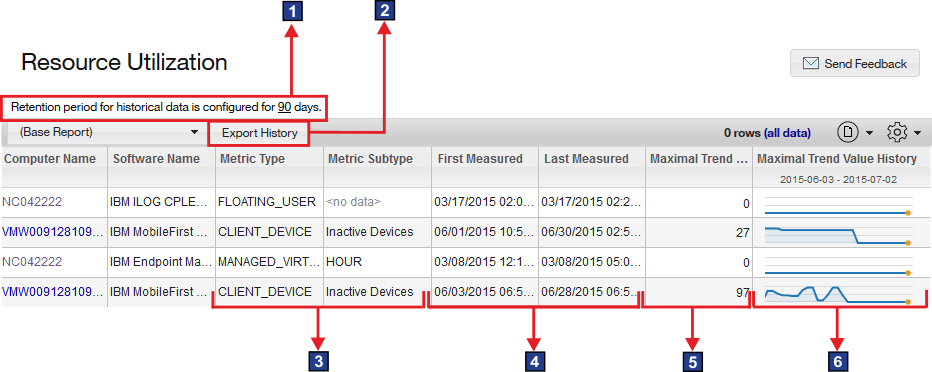
 Retention period setting
- To reduce the amount of resource utilization data, set the retention period after which the data is removed from the database. For more information, see: Configuring data retention period for raw utilization data.
 Export History
- History provides initially processed data about the average and maximum utilization of each license metric for each product for a specified period. It is different from export to CSV or PDF that includes only data that is visible on the user interface.
 Metric Type and Metric Subtype
- The type and subtype of license metrics that a product uses. The report does not show products that use the PVU, RVU MAPC or Install Seats metric. To view these products, open the All Metrics report.
 First Measured and Last Measured
- The first and last time when each metric was reported.
 Maximal Trend Value
- The maximum utilization of each license metric over the last 30 days. If a particular product is unused, no resource utilization data is available, or the data is older than 30 days, the value is 0.
 Maximal Trend Value History
- Trend value of the maximum utilization over the last 30 days. When the graph shows 0 for a specific period, it means that there is no data, or there was no license utilization during this period. To recognize which is the case, click Export History to save the report to a file. Then, open the file, and check if the entries that show 0 in the user interface also show 0 in the file. If they do, it means that the license utilization during this period equals 0. If there are no such entries, the data from this period was not reported.
Aggregating the data
If you want to aggregate the data according to your license agreement, export the history of license metric utilization and aggregate it outside of BigFix Inventory. Apply all necessary filters on the Resource Utilization report, and click Export History. The csvhistory.zip file is downloaded to your computer. It contains the export_history.csv file that provides initially processed data about the average and maximum utilization of each license metric for each product.
Example


| Computer Name | Software Name | Metric Type | Metric Subtype | Start Time (UTC 0) | End Time (UTC 0) | Value |
|---|---|---|---|---|---|---|
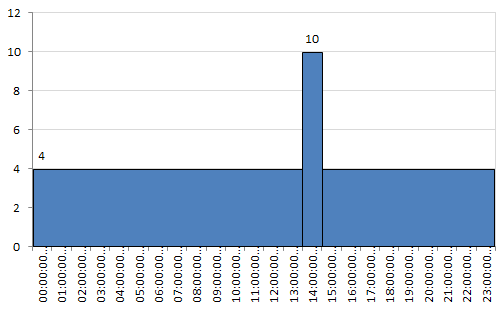
| VMW00912 | IBM Product | CONCURRENT_USER | 2015-06-20 00:00:00.0 | 2015-06-20 14:00:00.0 | 4 | |
| VMW00912 | IBM Product | CONCURRENT_USER | 2015-06-20 14:00:00.0 | 2015-06-20 15:00:00.0 | 10 | |
| VMW00912 | IBM Product | CONCURRENT_USER | 2015-06-20 15:00:00.0 | 2015-06-21 00:00:00.0 | 4 |