Dashboard
The dashboard provides you with a quick overview of the most important information about scans, computers, and software assets in your infrastructure.
 New Dashboard and Reporting
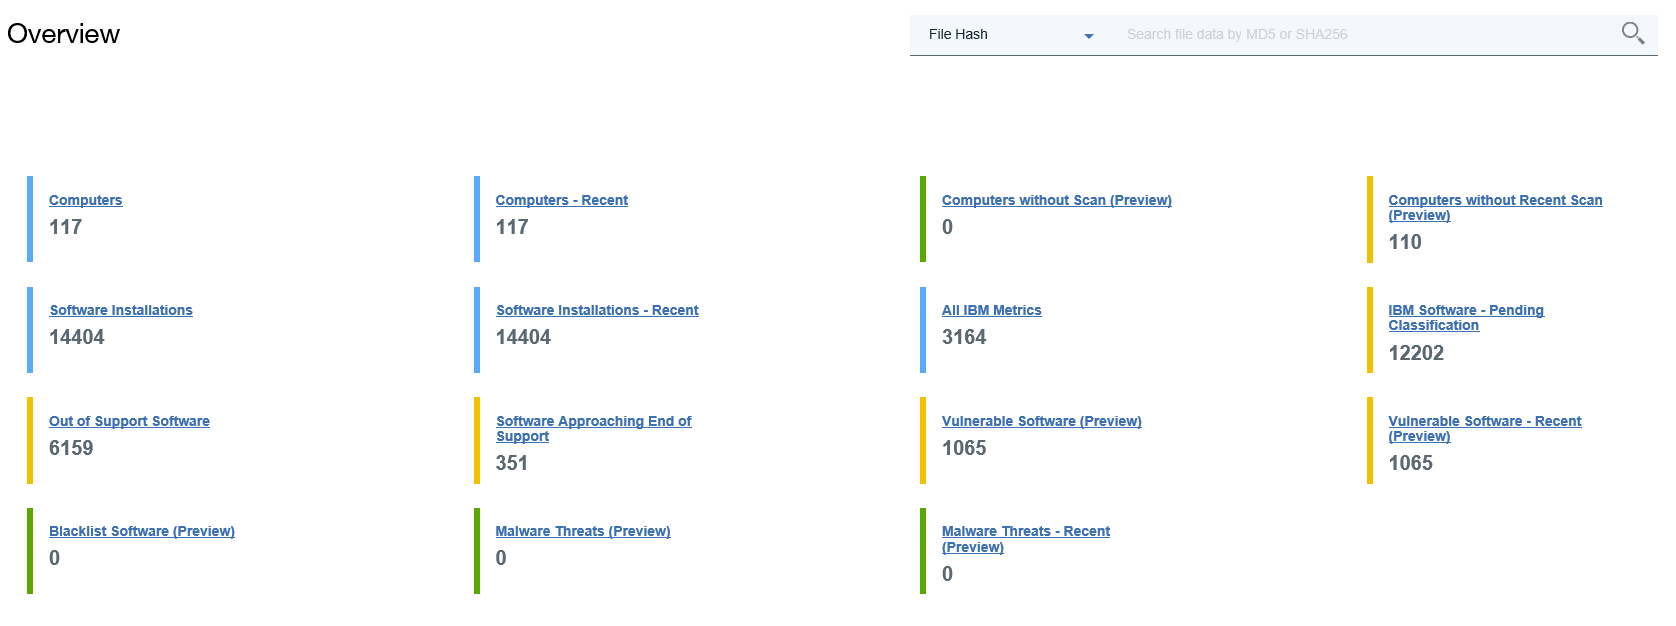
- Search the file data by the file hash.
- Search the file data by the file name.
- Search the vulnerable software by the CVE name.
- Search the software inventory by the component name.
Dashboard
If you use BigFix Inventory 9.2.12 or earlier, your dashboard contains the following widgets.
Deployment Health
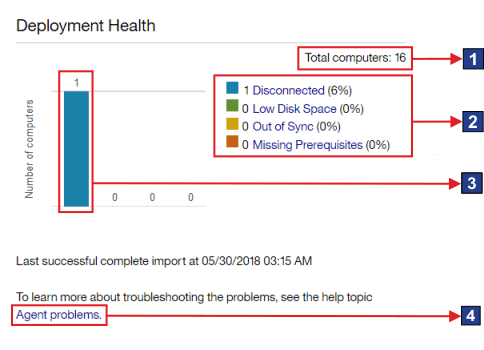
- Elements of the widget
 The total number of computers to which the user has access. The number is
determined by the computer group to which the user is assigned.
 The total number of computers includes Mac computers. However, information about deployment
health is not collected from these systems. Thus, they are not included in the counts for particular
statuses.
Scan Health
The widget shows the health of scans that are running in your infrastructure. When software scans are not working correctly, the installed software might not be discovered.
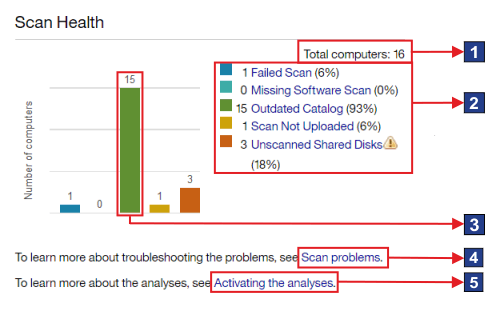
- Elements of the widget
 The total number of computers to which the user has access. The number is
determined by the computer group to which the user is assigned.
 The total number of computers includes Mac computers. However, only information about the
status of the package data scan is collected from these systems. Therefore, Mac computers are
included in the count for the Failed Scan status. They are not included in the counts for the
remaining statuses.
IBM Capacity Data Completeness
The widget shows whether capacity data is correctly gathered from the computers in your infrastructure. The lack of capacity data might impact calculation of PVU consumption.
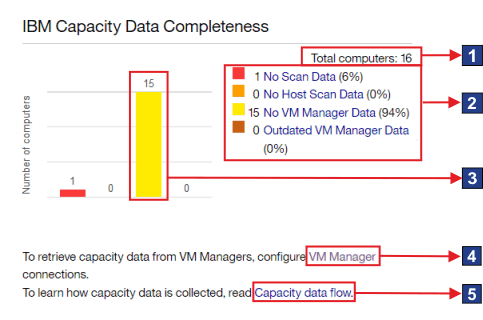
- Elements of the widget
 The total number of computers to which the user has access. The number is
determined by the computer group to which the user is assigned.
 The total number of computers includes Mac computers. However, information about capacity
data is not collected from these systems. Thus, they are not included in the counts for particular
statuses.
Inventory Exploration
The widget shows top five publishers with the largest number of defined contracts. The publishers are ordered according to the number of computers on which their software is installed, regardless of the number of contracts.
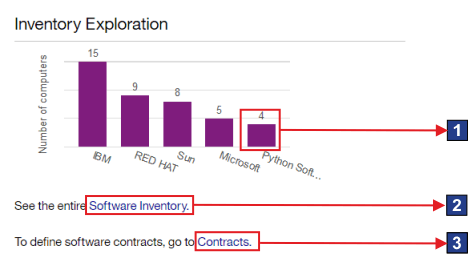
- Elements of the widget
 The number of products from a particular publisher.
Inventory Data
The widget shows a summary of the installed BigFix software as well as computers, and computer groups in your infrastructure.
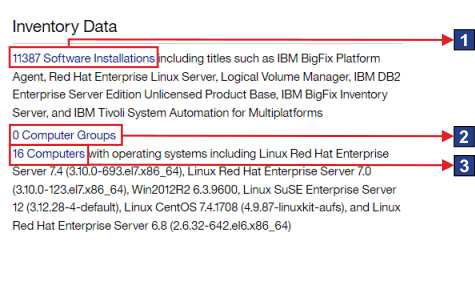
- Elements of the widget
 A link to the Software Installations report.
Software Catalog
The widget shows information about the content and version of the current software catalog.
IBM PVU Subcapacity
The widget shows products with the highest PVU consumption rate. It shows how many PVUs a product consumes but does not relate this information to your license entitlements. By default, the maximum of five products is displayed.
The accuracy of the displayed data depends on when the scan data was imported, whether the PVU table is up-to-date, and whether software assignment was modified. If any of these factors was changed, an appropriate message is displayed on the widget.
If the widget shows No data, the data is not available. It might occur when scan
data was not uploaded, the upload of the data has not finished yet, or inventory scans do not work
properly. The message is no longer displayed if data from at least one BigFix client is successfully updated.
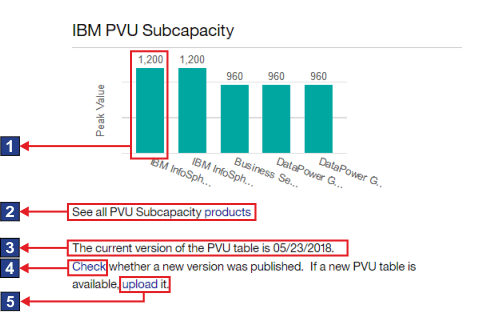
- Elements of the widget
 The PVU consumption rate for a product.
BigFix
The widget shows the number of completed and pending classifications of the software that is installed in your infrastructure.
The accuracy of the displayed data depends on when the scan data was imported and whether the part numbers file is up-to-date. If any of these factors was changed, an appropriate message is displayed on the widget.
If the widget shows No data, the data is not available. It might occur when scan
data was not uploaded, the upload of the data has not finished yet, or inventory scans do not work
properly. The message is no longer displayed if scan data from at least one BigFix client is successfully updated.
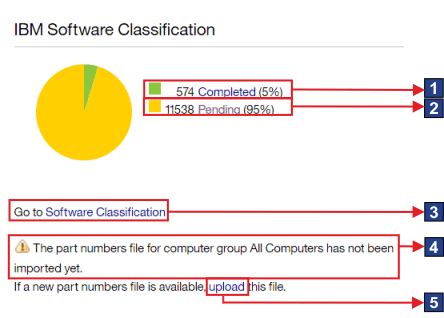
- Elements of the widget
 A link to the Software Classification
panel with results narrowed down to software installations with complete classification.
 Links to the report with results narrowed down to computers with the particular
status.
 The number of computers with a particular status.
 Link to information about
  Link to information about