Filters
Filters are a key part of most reports. They allow you to view just one facet of the data at a time. Data fields can be filtered individually, limiting the data that is displayed. This technique is a form of Facet Navigation, and is a powerful way to reduce a huge data set to something easily tractable.
The Filter interface is nearly the same wherever you see it. This section highlights the essentials of designing powerful and effective filters, and is referred to elsewhere in this guide.
The default filter specifies nothing, allowing all data records to be listed.
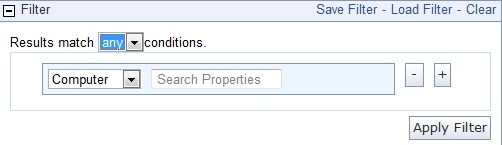
To view a subgroup of the data, pull down the menu to filter by computer, content, site or a previously saved filter. The choice you make determines the secondary fields of the filter. For example, you might want to view computers that have specific operating systems. Click in the box labeled Search Properties and enter "OS". There might be a pause while the system collects the properties and verifies the existence of the OS property.
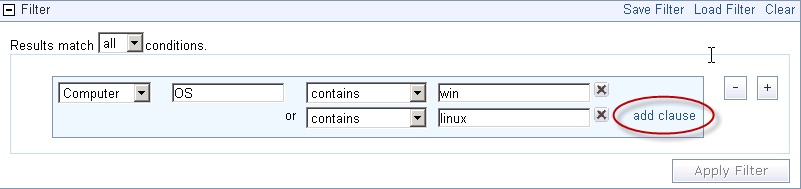
Click the link labeled add clause to add extra qualifiers to a filter. Click the associated X to delete any of these clauses.
Click the plus sign to the right of the filter to add a new one.
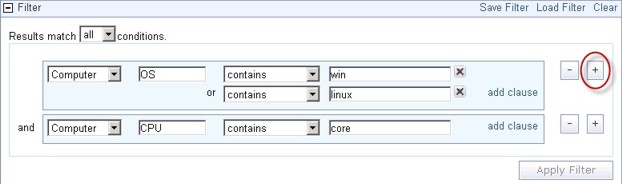
These filters are ANDed together if you choose all conditions; they are ORed together if you choose any conditions. Click the minus sign next to a filter to delete it from the set.
Click the Apply Filter button to see how your custom filter affects the subsequent computer reports and charts.
When defined, click the Save Filter link at the upper right if you want to save your work as a custom named filter. Later you can use this filter in other circumstances by clicking the Load Filter link or by selecting it from the conditions pull-down menu.