Viewing Analyses
To display an Analysis,
- Click the Analyses icon in the Domain Panel navigation tree.
- Click an entry in the resulting Analysis List Panel.
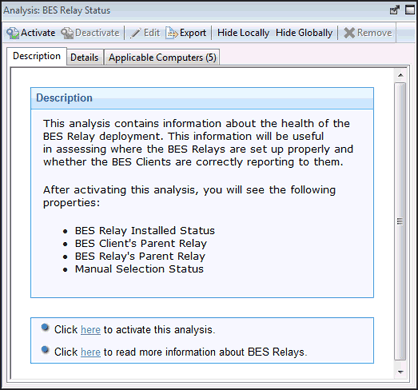
The body of the Analysis is shown in the Work Area below the list (click the Description tab if not already selected).

The Analysis display region has several tabs:
- Description: This is an HTML page providing a description of the analysis.
- Details: This panel provides a property-by-property listing of the chosen analysis, as well as the Relevance statement that is being used to target the chosen computers. At the bottom is a text box for entering a comment that to be attached to this analysis.
- Results: This dialog lists the actual results of the analysis, which can be filtered and sorted by the pre-assigned properties (this tab is only available if the Analysis is activated).
- Applicable Computers: This is a filter/list of all the computers where the selected analysis is applicable. You can filter the list by selecting items from the folders on the left, and sort the list by clicking the column headers.
