Overview Report
The following graphical reports are available from the primary Overview window of the Vulnerability domain dashboard:
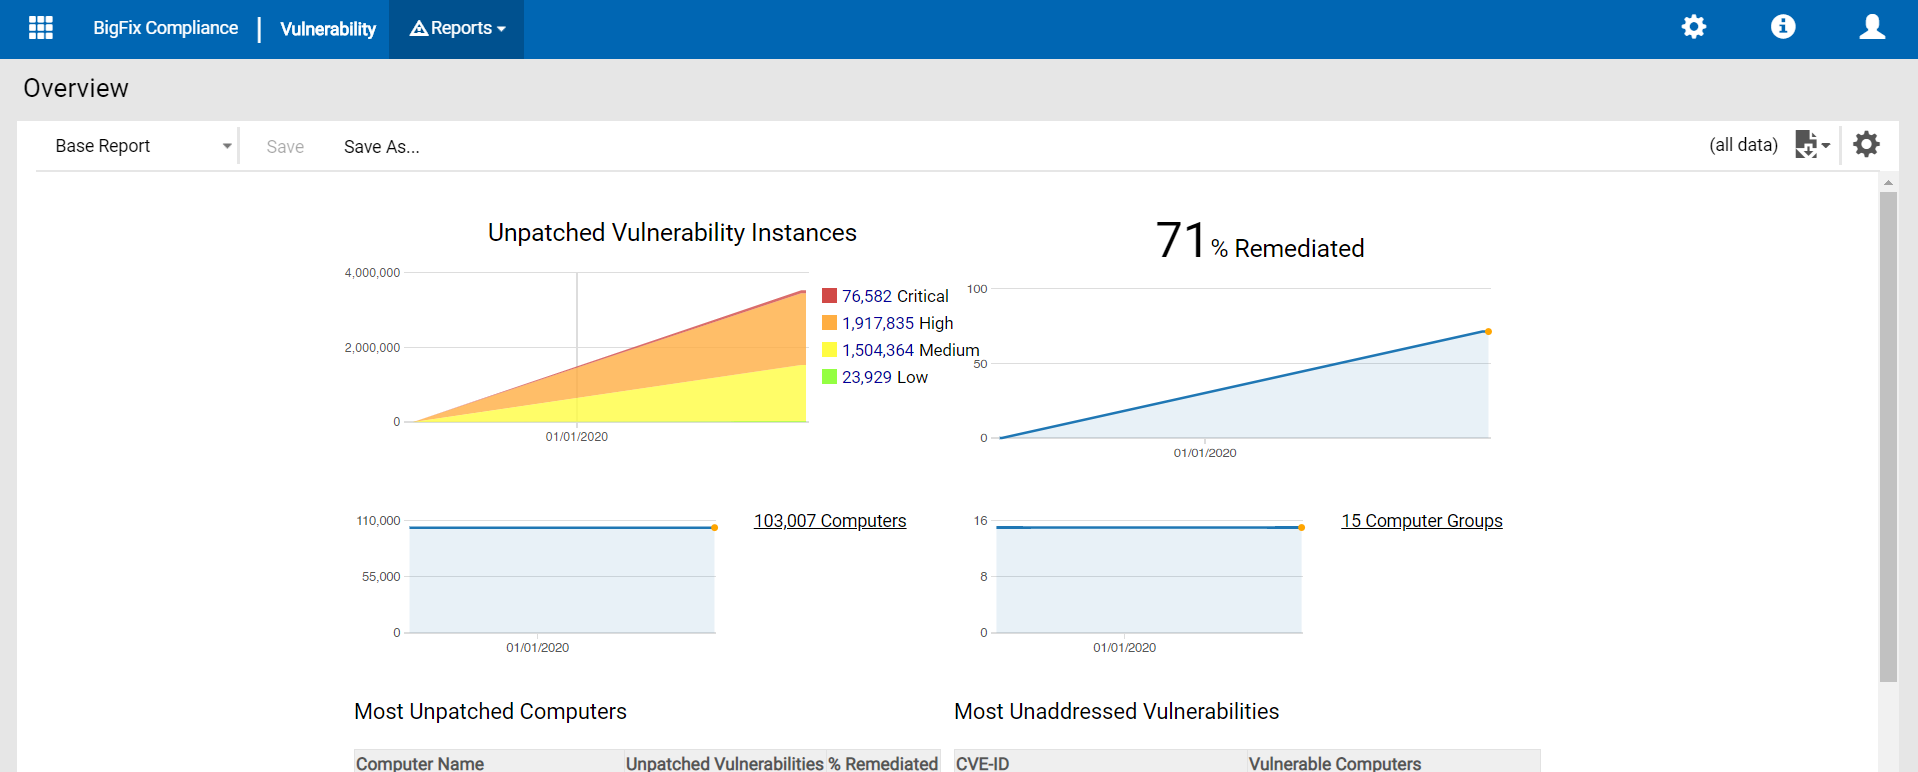
- Deployment Overview
- Displays the current unpatched vulnerability instances, and the applied
remediation.
The Unpatched Vulnerability Instances report displays all the instances of the vulnerability across all the endpoints. For example, if 3 vulnerabilities are unpatched and present on 10 computers, the number of Unpatched Vulnerabilities Instances calculated will be a total of 30, that will be tracked in this report graph. Similarly the remediation percentage is the remediation of these vulnerability instances.
- Computer Overview
- Displays the current number of computers, the historical aggregate of the computers that are included in the report, and a summary of their operating system platforms.
- Computer Groups Overview
- Displays the current number of computer groups, the historical aggregate of computer groups that are included in the report, and a summary of the computer groups.
- Most Unpatched Computers Overview
- Displays the list of computers that require the most number of patches.
- Most Unaddressed Vulnerabilities
- Displays the list of unaddressed vulnerabilities.