Alert definitions
See all the alerts defined in AIDA. Pause one or more alerts immediately.
Before you begin
- Trigger
- A custom set of conditions, for example: 10 anomalous data points points falling outside the expected range of values.
- Timeframe (or Periodicity)
-
The time interval whose anomalies must be considered to detect an alert (for example: the last hour, or the last 10 minutes).
- ALERT_TOTAL, triggered by 3 (or more) anomalous data points above and below the predicted range, in 1 hour (for the job_history KPI, timeframe is 2 days).
- ALERT CONTINUOUS, triggered by 10 (or more) anomalous data points all above or below the predicted range, in 1 hour (for the job_history KPI, timeframe is 2 days).
[
    {
    "definitionID": "CONTINUOUS_JOBWKS",
    "name": "Continuous anomalies for jobs in plan by workstation",
    "kpi": "application_wa_JobsByWorkstation_jobs",
    "trigger":{
                "type": "continuous",
                "value": 10,
                "timeFrame": 60,
                "description": "Over 10 Consecutive  Anomalies within 1 hour"
               },
    "periodicity": "1 hour",
    "isActive": "true"
    },

   {
    "definitionID": "TOTAL_JOBWKS",
    "name": "Total Anomalies for Jobs in plan by Workstation",
    "kpi": "application_wa_JobsByWorkstation_jobs",
    "trigger":{
                "type": "total",
                "value": 3,
                "timeFrame": 60,
                "description": "Over 3 Anomalies within 1 hour"
               },
    "periodicity": "1 hour",
    "isActive": "false"
    },
    {
    "definitionID": "CONTINUOUS_JOBFOLDER",
    "name": "Continuous Anomalies Jobs in plan by Folder",
    "kpi": "application_wa_JobsByFolder_jobs",
    "trigger":{
                "type": "continuous",
                "value": 10,
                "timeFrame": 60,
                "description": "Over 10 Consecutive  Anomalies within 1 hour"
               },
    "periodicity": "1 hour",
    "isActive": "true"
    },

    {
    "definitionID": "TOTAL_JOBFOLDER",
    "name": "Total Anomalies for Jobs in plan by Folder",
    "kpi": "application_wa_JobsByFolder_jobs",
    "trigger":{
                "type": "total",
                "value": 3,
                "timeFrame": 60,
                "description": "Over 3 Anomalies within 1 hour"
               },
    "periodicity": "1 hour",
    "isActive": "false"
    },
    {
    "definitionID": "CONTINUOUS_JOBSTATUS",
    "name": "Continuous Anomalies for Jobs in plan by status",
    "kpi": "application_wa_JobsInPlanCount_job",
    "trigger":{
                "type": "continuous",
                "value": 10,
                "timeFrame": 60,
                "description": "Over 10 Consecutive  Anomalies within 1 hour"
               },
    "periodicity": "1 hour",
    "isActive": "true"
    },
    {
    "definitionID": "TOTAL_JOBSTATUS",
    "name": "Total Anomalies for jobs in plan by status",
    "kpi": "application_wa_JobsInPlanCount_job",
    "trigger":{
                "type": "total",
                "value": 3,
                "timeFrame": 60,
                "description": "Over 3 Anomalies within 1 hour"
               },
    "periodicity": "1 hour",
    "isActive": "false"
    },
    {
    "definitionID": "CONTINUOUS_JOBTOTAL",
    "name": "Continuous Anomalies for total jobs",
    "kpi": "application_wa_JobsInPlanCount_job_total",
    "trigger":{
                "type": "continuous",
                "value": 10,
                "timeFrame": 60,
                "description": "Over 10 Consecutive Anomalies within 1 hour"
               },
    "periodicity": "1 hour",
    "isActive": "true"
    },
    {
    "definitionID": "TOTAL_JOBTOTAL",
    "name": "Total Anomalies for total jobs",
    "kpi": "application_wa_JobsInPlanCount_job_total",
    "trigger":{
                "type": "total",
                "value": 3,
                "timeFrame": 60,
                "description": "Over 3 Anomalies within 1 hour"
               },
    "periodicity": "1 hour",
    "isActive": "false"
    },
    {
    "definitionID": "CONTINUOUS_JOBHISTORY",
    "name": "Continuous Anomalies for job history",
    "kpi": "job_history",
    "trigger":{
                "type": "continuous",
                "value": 2,
                "timeFrame": 2880,
                "description": "Over 10 Consecutive Anomalies within 2 days"
               },
    "periodicity": "1 hour",
    "isActive": "true"
    },
    {
    "definitionID": "TOTAL_JOBHISTORY",
    "name": "Total Anomalies for job history",
    "kpi": "job_history",
    "trigger":{
                "type": "total",
                "value": 2,
                "timeFrame": 2880,
                "description": "Over 3 Anomalies within 2 days"
               },
    "periodicity": "1 hour",
    "isActive": "false"
    },
    {
    "definitionID": "CONTINUOUS_MESSAGE",
    "name": "Continuous Anomalies for message files fill percentile",
    "kpi": "application_wa_msgFileFill_percent",
    "trigger":{
                "type": "continuous",
                "value": 10,
                "timeFrame": 60,
                "description": "Over 10 Consecutive Anomalies within 1 hour"
               },
    "periodicity": "1 hour",
    "isActive": "true"
    },
    {
    "definitionID": "TOTAL_MESSAGE",
    "name": "Total Anomalies for message files fill percentile",
    "kpi": "application_wa_msgFileFill_percent",
    "trigger":{
                "type": "total",
                "value": 3,
                "timeFrame": 60,
                "description": "Over 3 Anomalies within 1 hour"
               },
    "periodicity": "1 hour",
    "isActive": "false"
    }
]
About this task
From AIDA
left-hand sidebar, select Alert Definitions. 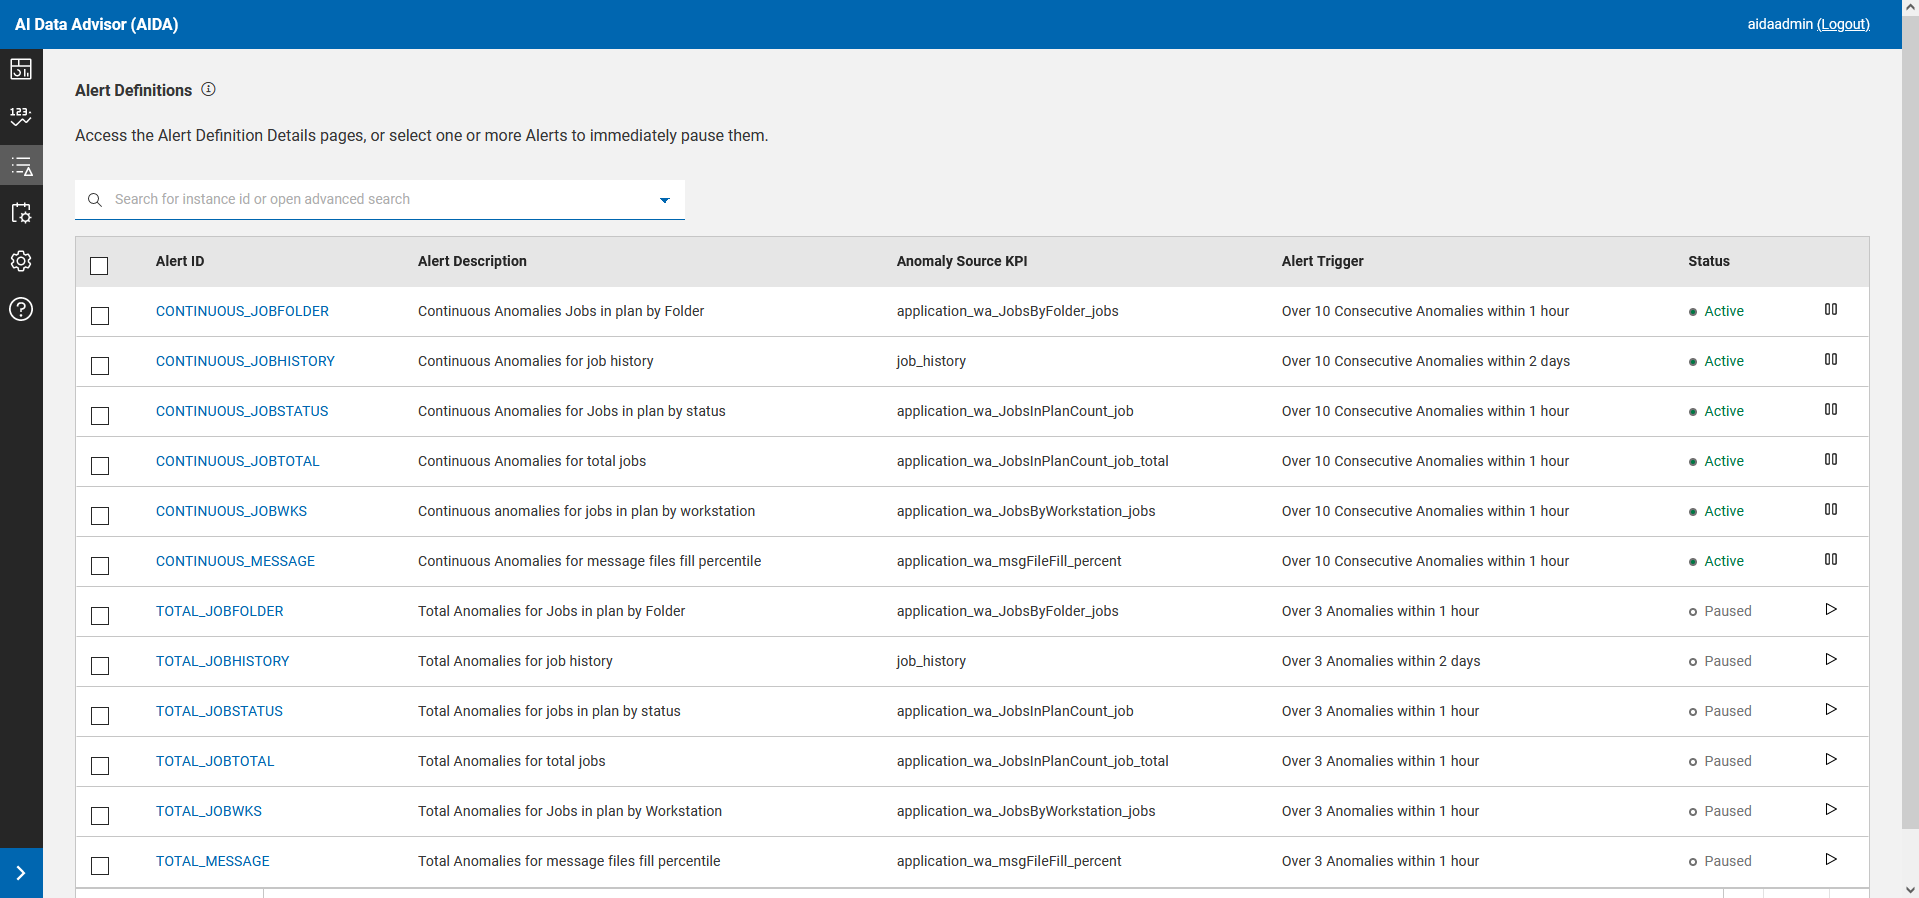
In this page you can view the full list of alert definitions in table format. The search bar allows you to search for one ore more alert definitions.
- Alert ID
- The ID of the alert.
- Alert Description
- The description of the alert.
- Anomaly Source KPI
- The KPIs that contribute to generate the alert (can be more than one KPI).
- Alert Trigger
- Set of conditions defining the alert. For example: Over 3 anomalies within 1 hour.
- Status
- The status of the alert. It can be Active or Paused.
Click on an alert definition to open the Alert Definition Details where you can get detailed information about the alert, its definition and history. For details, see Alert definition details.
An action icon is available for each alert definition to Pause or Resume the alert generation. For details about pausing an alert, see Pause alert generation.
By selecting multiple alert definitions, the following bulk action icon appears in the table header:- Pause now/Resume
- To pause or resume the generation of the selected alerts. Only the Pause now action is available for multiple alerts.