Detecting anomalies in the workload
By predicting KPIs time series, AIDA can identify anomalies in the number of completed jobs in the current plan.
Jason works as an HCL Workload Automation operator for a large bank. In his job, he needs to quickly find issues with the workload, understand the impacts, and alert the right people.
While some critical batch processing is running, an alert shows up on the Workload Dashboard: the number of jobs completed in the Loan and Mortgage folder is lower than expected. From the Dashboard, Jason can open AIDA UI and analyze the reported anomaly.
On the Anomaly Data Analysis page, he can see a graph with the number of jobs completed in the folder, compared to the expected range of values. The anomaly is highlighted in the graph where a light-blue area represents the expected range of values, statistically defined based on HCL Workload Automation historical data. Jason can also compare the anomalous trend with the trend on a similar day. He can also add more days for comparison.
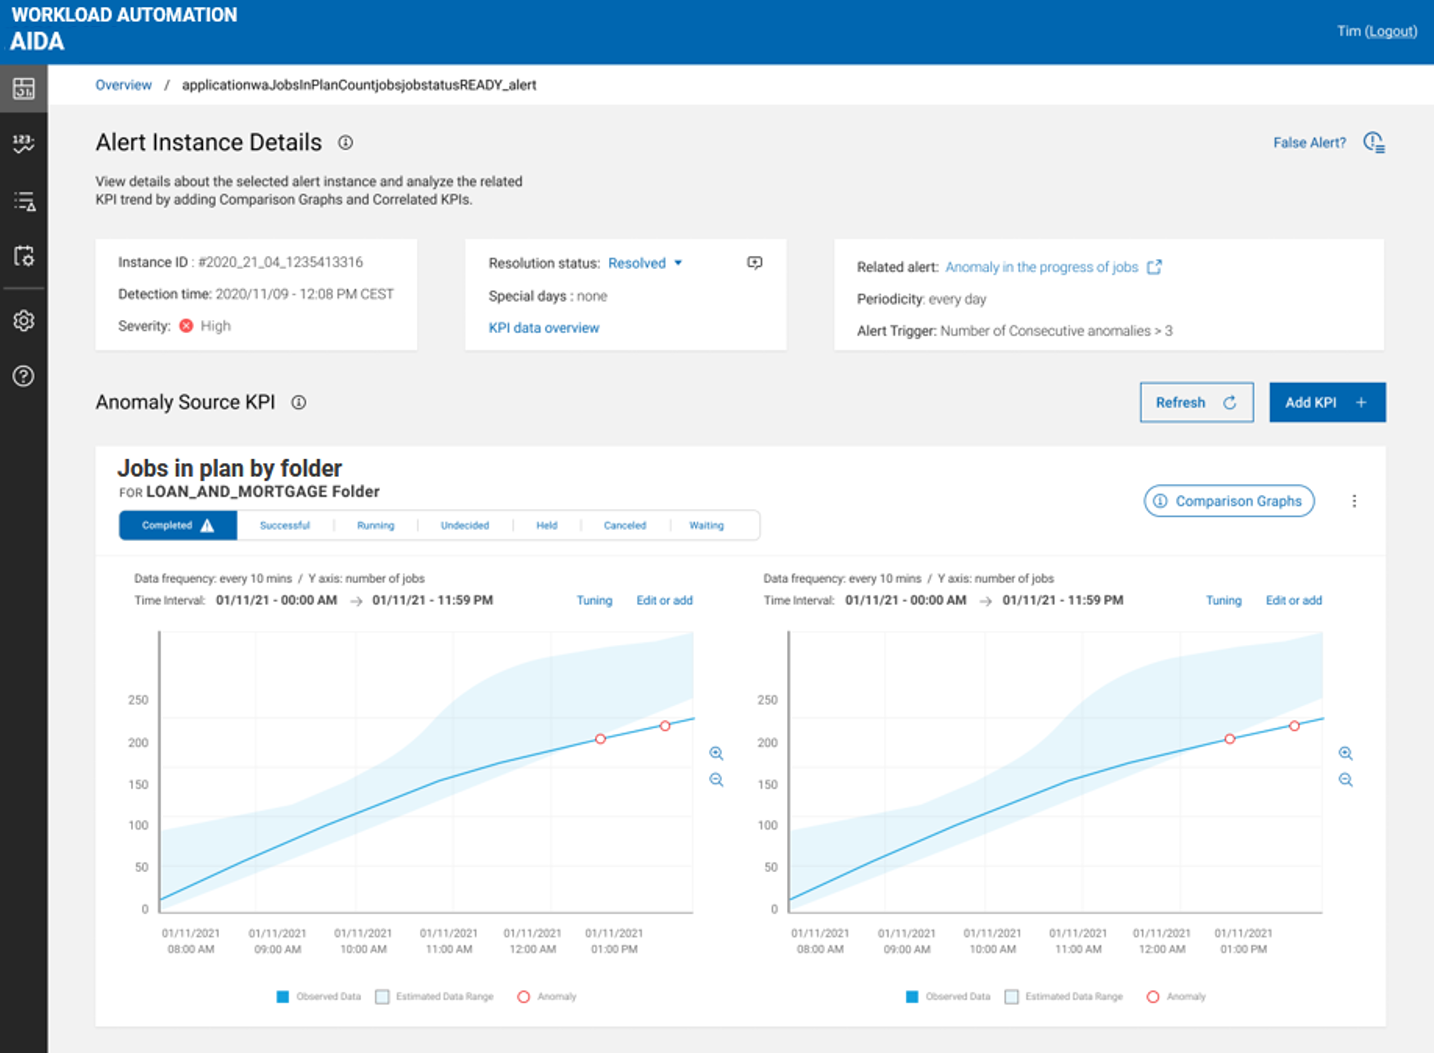
An anomaly can have multiple causes with different severities: to find root causes faster, Jason clicks the Add KPI button to add correlated Key Performance Indicators to the anomaly data analysis. From the Add KPI panel, he selects the workload trend by workstation.
Workstation SAP1 shows a certain percentage of anomaly with the number of waiting jobs. Jason selects this KPI. A new graph is added to AIDA UI showing the today trend of jobs waiting on SAP1. Jason adds a comparison graph to analyze the KPI trend on different days. For the selected days, the KPI shows a regular trend, therefore he understands that to manage the unusual number of waiting jobs on the SAP workstation, he needs to contact the SAP administrator to free up some resources.
Jason opens a high severity ticket to have the issue quickly resolved, then marks the alert as resolved.
By using AIDA, and leveraging the correlated KPIs analysis, Jason was able to easily analyze the detected anomaly, quickly identifying and addressing the root causes of problem, without compromising the SLA.
AIDA is much more than anomaly detection and analysis.
A special page can be opened directly from the Monitor Job UI of the Dynamic Workload Console, showing the trend of all the KPIs available for a job.
AIDA can also be used by HCL Workload Automation administrators to:
- Pause and activate an alert generation.
- Set Special Days for each KPI in a dedicated UI, to include them in the prediction model with a higher tolerance.
- Fine-tune the KPI prediction.
- Retrain the ML prediction model.