To run the Project Performance Crosstab report
About this task
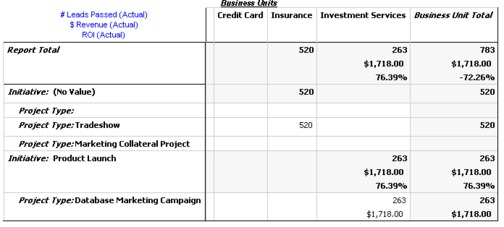
The Project Performance Crosstab report shows high-level project metrics in a cross tabulation along multiple dimensions of custom attributes.
The example included is a cross tab of project performance metrics including leads passed, revenue, and ROI (Return on Investment), aggregated over initiative and project type vs. business units.
This report requires the Financial Management Module.
Procedure
Results
The sample report provided contains the following information:
- Row Dimensions: (1) Initiative, (2) Project Type
Data in the rows is grouped by Initiative; you can use this field to categorize your programs and plans. Each Initiative section contains rows for each Project Type included in the report.
Project type is determined from the template used for creating the project. Sample project types are Database Marketing Campaign, Tradeshow Template, Marketing Collateral, and Campaign Project Template.
- Column Dimension: Business Unit
A business unit is a field on the project and plan creation page. It is one way to categorize projects and plans.
- Metrics to show: number of leads passed, revenue, and ROI (Return
on Investment)
Example of a Project Performance Crosstab report: