Task flow in using the KairosDB UI
You can perform tasks in sequence to use the KairosDB UI to query the data store and graphically view stub metrics for virtual services.
Launching the KairosDB UI
To view the query and the graph of the metrics for the stubs running on HCL® Quality Server, you must launch the KairosDB UI.
About this task
You must complete the prerequisite tasks before you launch the KairosDB UI. You must use a browser on the same system that is running the HCL® Quality Server instance.
Procedure
-
Use the URL
http://localhost:7828/to launch the KairosDB UI.The KairosDB UI is displayed as shown in The KairosDB UI.
Figure 1. The KairosDB UI 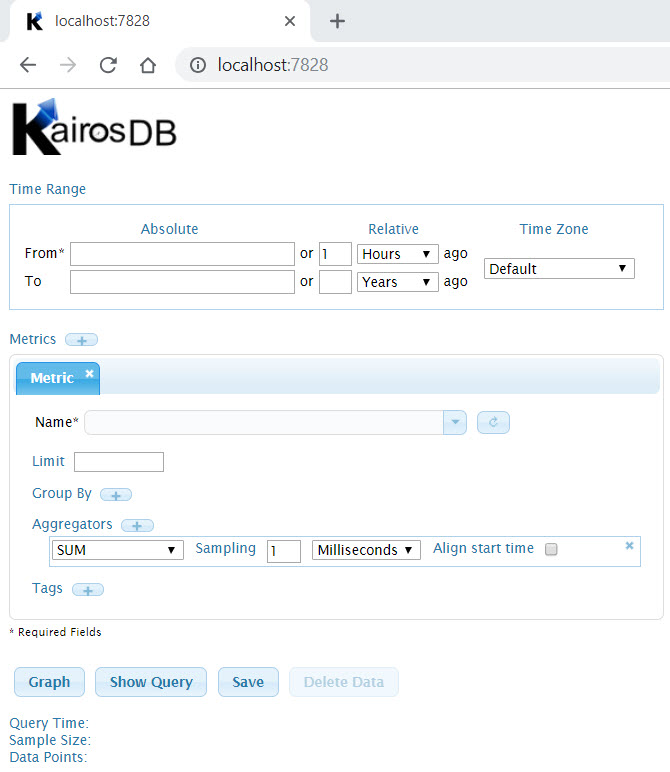 Note: The mandatory fields to be selected are marked with an Asterisk (*).
 -
Before you generate a graph for the metrics, complete the following
steps:
- Select a time range.
- Select one or more metrics.
You can then view the graph for the details you specified. You can also add Tags or Aggregators to generate custom views for the data values of the metrics.
Results
You have successfully launched the KairosDB UI. However, you must configure more settings to view the graph.
What to do next
You must continue to select a time range for the data points stored.
Selecting a time range and the time zone
You must first select the time range during which the KairosDB collected the metrics for the stubs. The time would correspond to the time when the stubs ran on HCL® Quality Server.
About this task
You can also find the time when the stubs ran by using the Usage page accessed from HCL® Quality Server. For more information, see Viewing usage statistics of virtual services in HCL Quality Server.
Procedure
-
Launch the KairosDB UI.
See Launching the KairosDB UI. The Time Range panel in the UI is as shown in The Time Range panel.
Figure 2. The Time Range panel 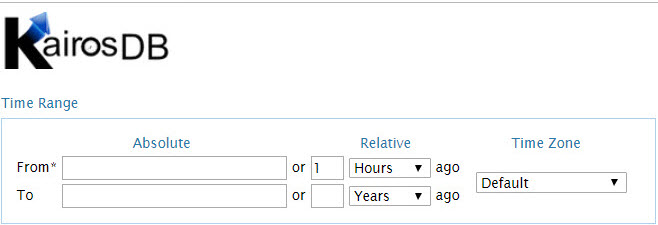
-
In the Time Range panel, select one from the following options:
- Specify the Time Zone by selecting one from the list or let the Default time zone remain unchanged. The default time zone corresponds to the server time zone on which the HCL® Quality Server runs.
Results
You have successfully configured the time range and the time zone by using the KairosDB UI.
What to do next
Selecting metrics
You must select metrics for the stubs you ran to include them in the KairosDB query.
Before you begin
You must have completed the prerequisite tasks before you launch the KairosDB UI. You must use a browser on the same system that is running the HCL® Quality Server instance. You must have launched the KairosDB UI and configured the time range before you select the metrics.
Procedure
-
From the list in the Name field, select any one
metric. For example, rtvs.stub.evt_match. See Selecting metrics in the KairosDB UI.
Figure 3. Selecting metrics in the KairosDB UI 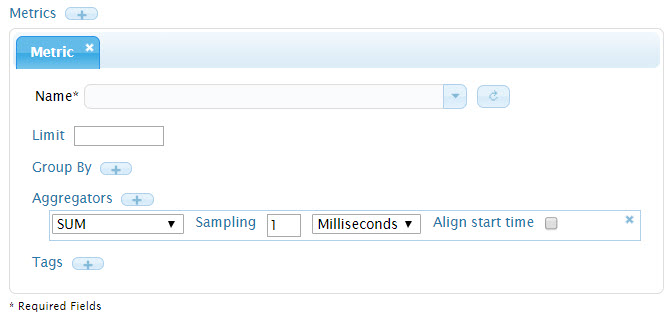 The following metrics are supported starting from 9.2.1 onwards:
- Events passed through (rtvs.stub.evt_passthrough). You must have set the pass-through configuration for the stubs. See Configuring stub pass-through behavior.
- Events that match input filters and are processed (rtvs.stub.evt_match).
- Events handled by a stub (rtvs.stub.evt_in).
- Set the number of records for which you want to view the metrics in the Limit field. For example, 100.
- You can view the graph of the metric by clicking Graph or you can proceed to view the graph after you group metrics and add aggregators to the grouped metrics.
-
You can add more than one metric to the query. To add a metric, click the
add metric (
 ) icon and complete the steps 1 and
2.
) icon and complete the steps 1 and
2.
Results
You can view the basic graph for the query or you can customize the view by grouping the data points and assigning aggregators to the grouped metrics.
What to do next
You can continue to group the metrics.
Grouping metrics
You can group the data points collected for the metrics in the database into groups and assign aggregators to the grouped data so that the data values can be presented in a simplified graph.
- By tags
- By a time range
- By value
You can assign more than one group to a metric. For example, you can group by a tag and time range so that you can see the grouped data points in a simplified view in the graph.
Grouping by tags
- To add a grouping item, click the
icon adjacent to Group By label.
- Select Tags from the list. The screen shown in
The Group by panel
is displayed.
Figure 6. The Group by panel 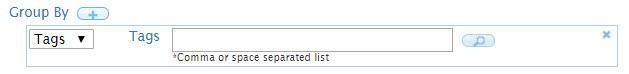
- Enter the tags you want to select for the data points in the
Tags field. You can also use the
Search icon (
 ) and add the tags from the list displayed for the metric. See Adding Tags to the group.
Figure 7. Adding Tags to the group 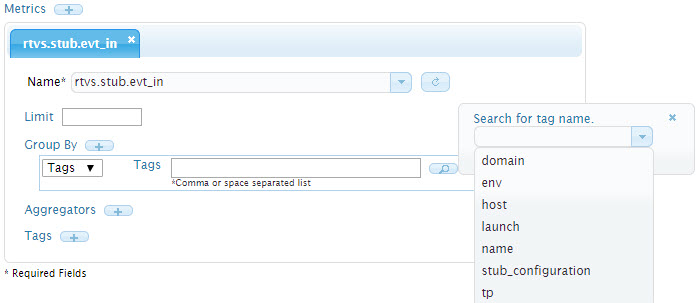
You can add multiple Group by items for the same metric by completing the tasks in Step 1 to Step 3.
You can view the graph for the query created by clicking Graph.
Grouping by time
- To add a grouping item, click the
icon adjacent to Group By label.
- Select Time from the list. The screen shown in
The Group by time panel is
displayed.
Figure 9. The Group by time panel 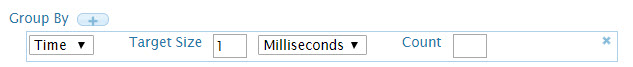
- Set the number of data points you want to be grouped in the Target Size field. For example, you can set the grouping of the data points for every 30 Seconds.
- Select the time value from the list. See Time-values for selection for
the time values you can select.
Figure 10. Time-values for selection 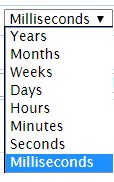
- Set the number of records for which, you want to view the metrics in the Count field. For example, 10.
You can view the graph for the query created by clicking Graph.
Grouping by value
- To add a grouping item, click the
icon adjacent to Group By label.
- Select Value from the list. The screen shown in
The Group by value panel is
displayed.
Figure 12. The Group by value panel 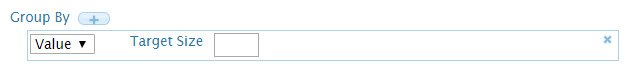
- Set the data value you want the data points within or equal to that value that is to be grouped in the Target Size field.
You can view the graph for the query created by clicking Graph.
Assigning aggregators
After you group the data points, you can assign aggregators to the grouped data points so that the selected operation is performed on the data points. For example, you can count the number of data points that exist in a 10-minute time period.
Procedure
-
To add an aggregator, click the icon
adjacent to Aggregators.
The screen shown in The Aggregators panel is displayed.
Figure 14. The Aggregators panel 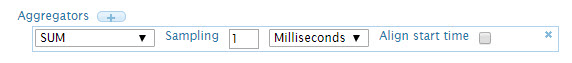
-
Select an aggregator from the list.
The list shown in List of aggregators is displayed.
Figure 15. List of aggregators 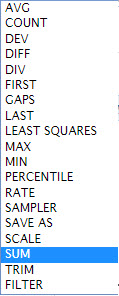
- Enter the number of data points you want to group in the Sampling field.
- Select the time value from the list for the grouping.
- Optional: Click the Align start time check box if the grouped data points must have the same starting point in the graph.
- Click Graph to view the graph for the query created.
Results
The graph is displayed for the query you created.
Assigning tags
You can use Tags in your query for the selected metric so that the result displays the data points with the selected tags and their values specified.
Procedure
-
To add a tag, click the icon
adjacent to Tags.
The screen shown in The Tags panel is displayed.
Figure 17. The Tags panel 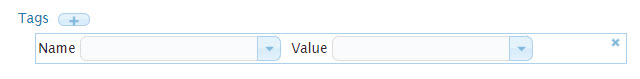
- Select the name of the tag from the list under Name.
-
Select and associate a value from the Value list.
For example, select Name for the Tag name and select
the stub name as the Value.
Note: Depending on the state of the stub configured, you can select the options for the attributes you want to be used in the graph for the selected metric. You can assign one or more tags to a metric.
-
Click Graph to view the graph for the query
created.
Results
The graph is displayed for the query you created.
Viewing the graph
You can view the graph for the query you created using the KairosDB UI. You can view the graph at any stage of the query you are creating.
Before you begin
- You have set up the database to collect the data points for the stub metrics, published stubs, and ran tests in HCL OneTest™ API.
- You have launched and set the time range in the KairosDB UI.
- You have selected the metrics for which you want to view the graph.
Procedure
-
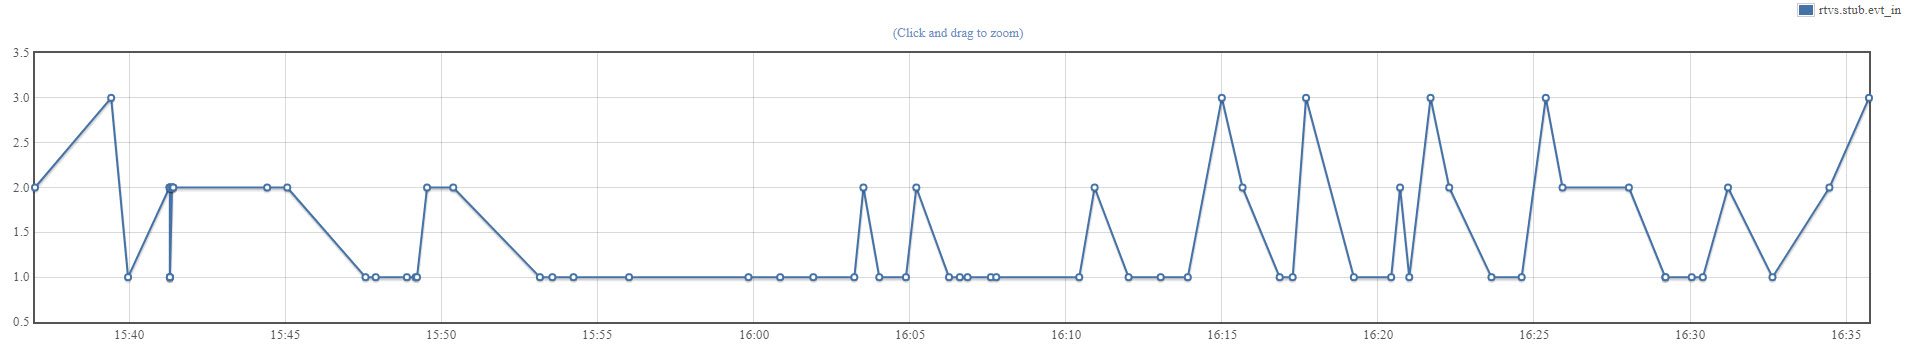
In the KairosDB UI, click Graph.
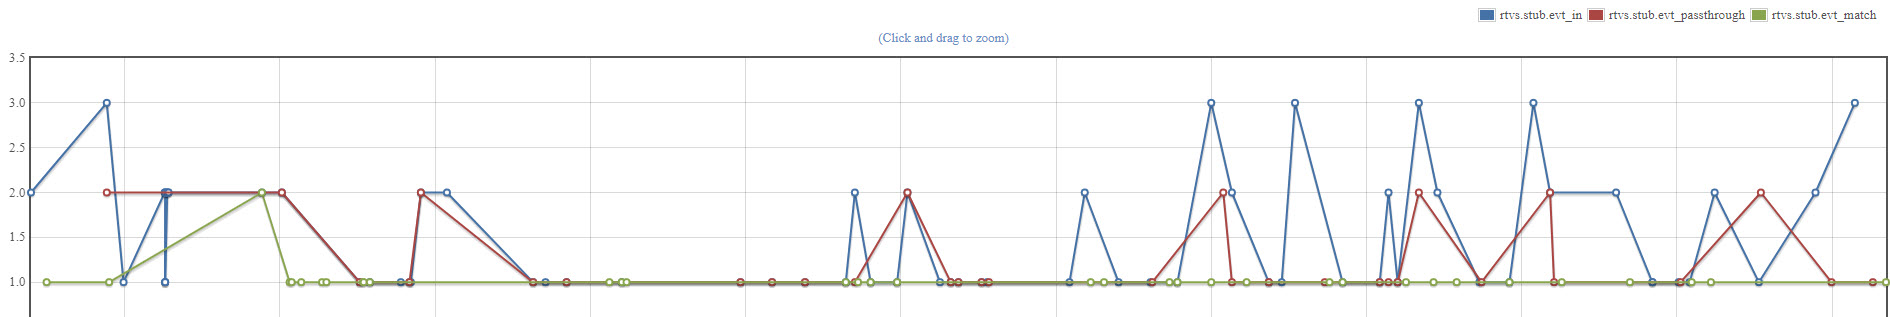
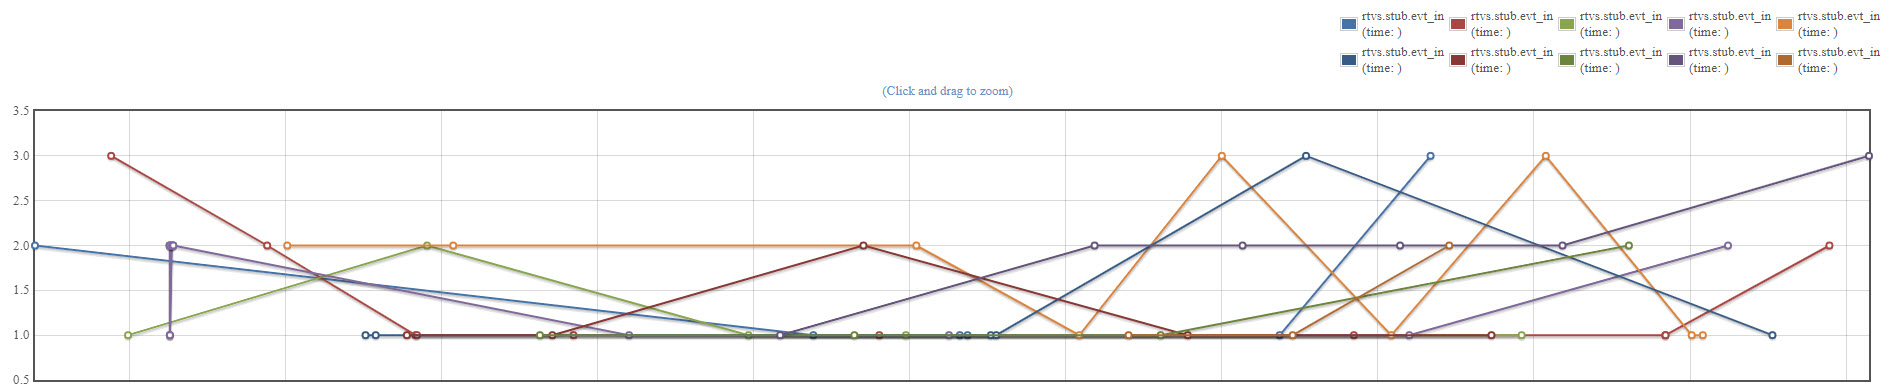
The graph shown in Graph of the stub metrics, as an example, is displayed for a query for the stub metrics in the selected time range.
Figure 19. Graph of the stub metrics 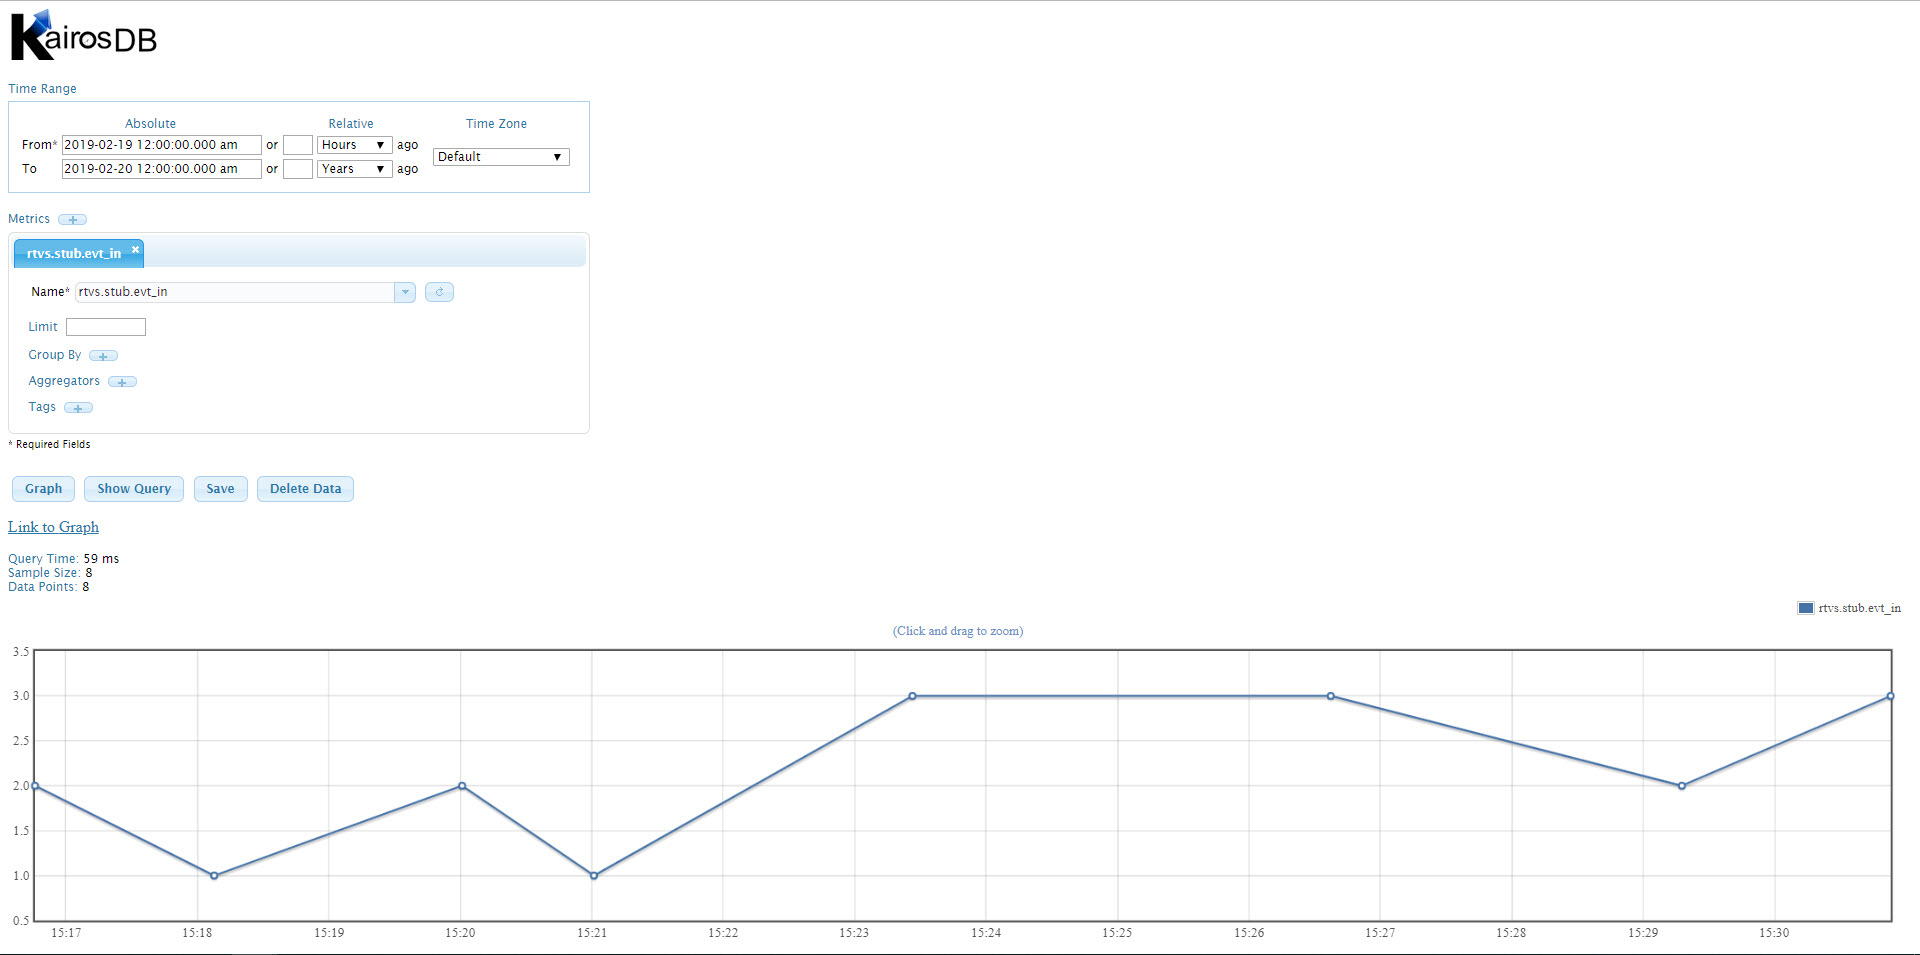
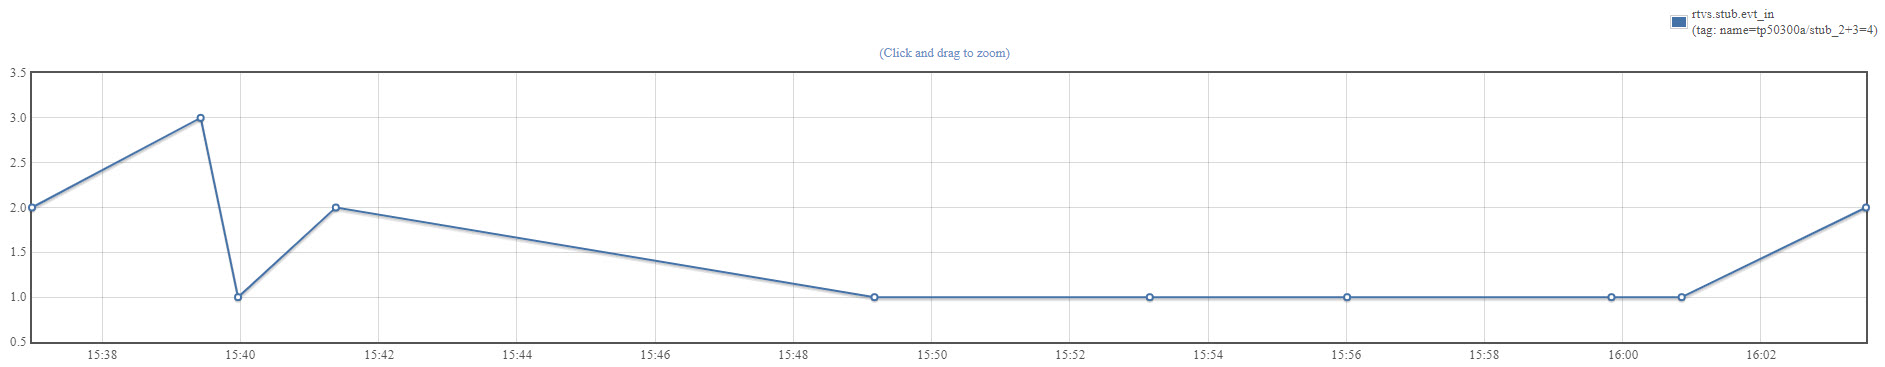
-
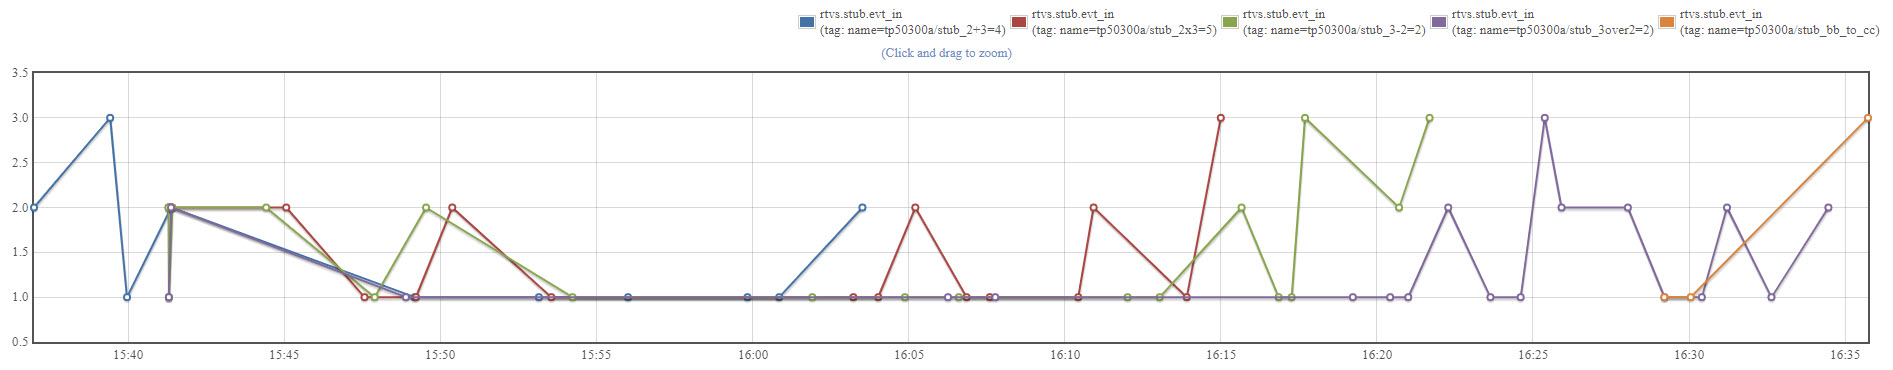
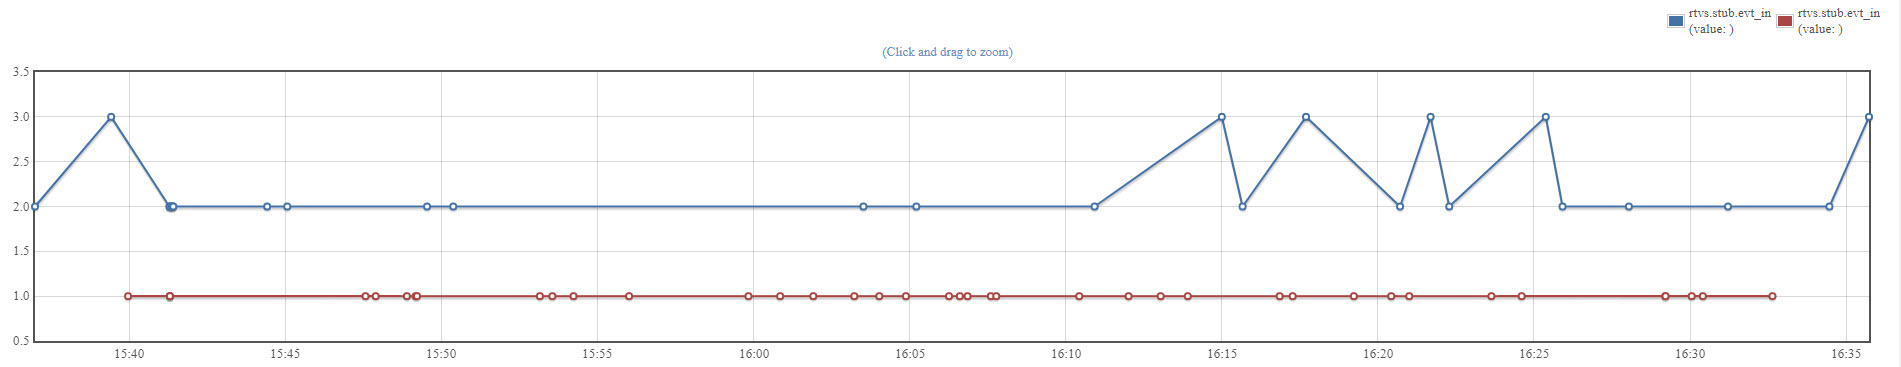
When you create a query for multiple stub metrics with one of the metrics
that is grouped by tags, and an aggregator (SUM) is
assigned, and you click Graph, the graph displays. As
an example, see the graph displayed in Graph of the metrics query for
such a query.
Figure 20. Graph of the metrics query 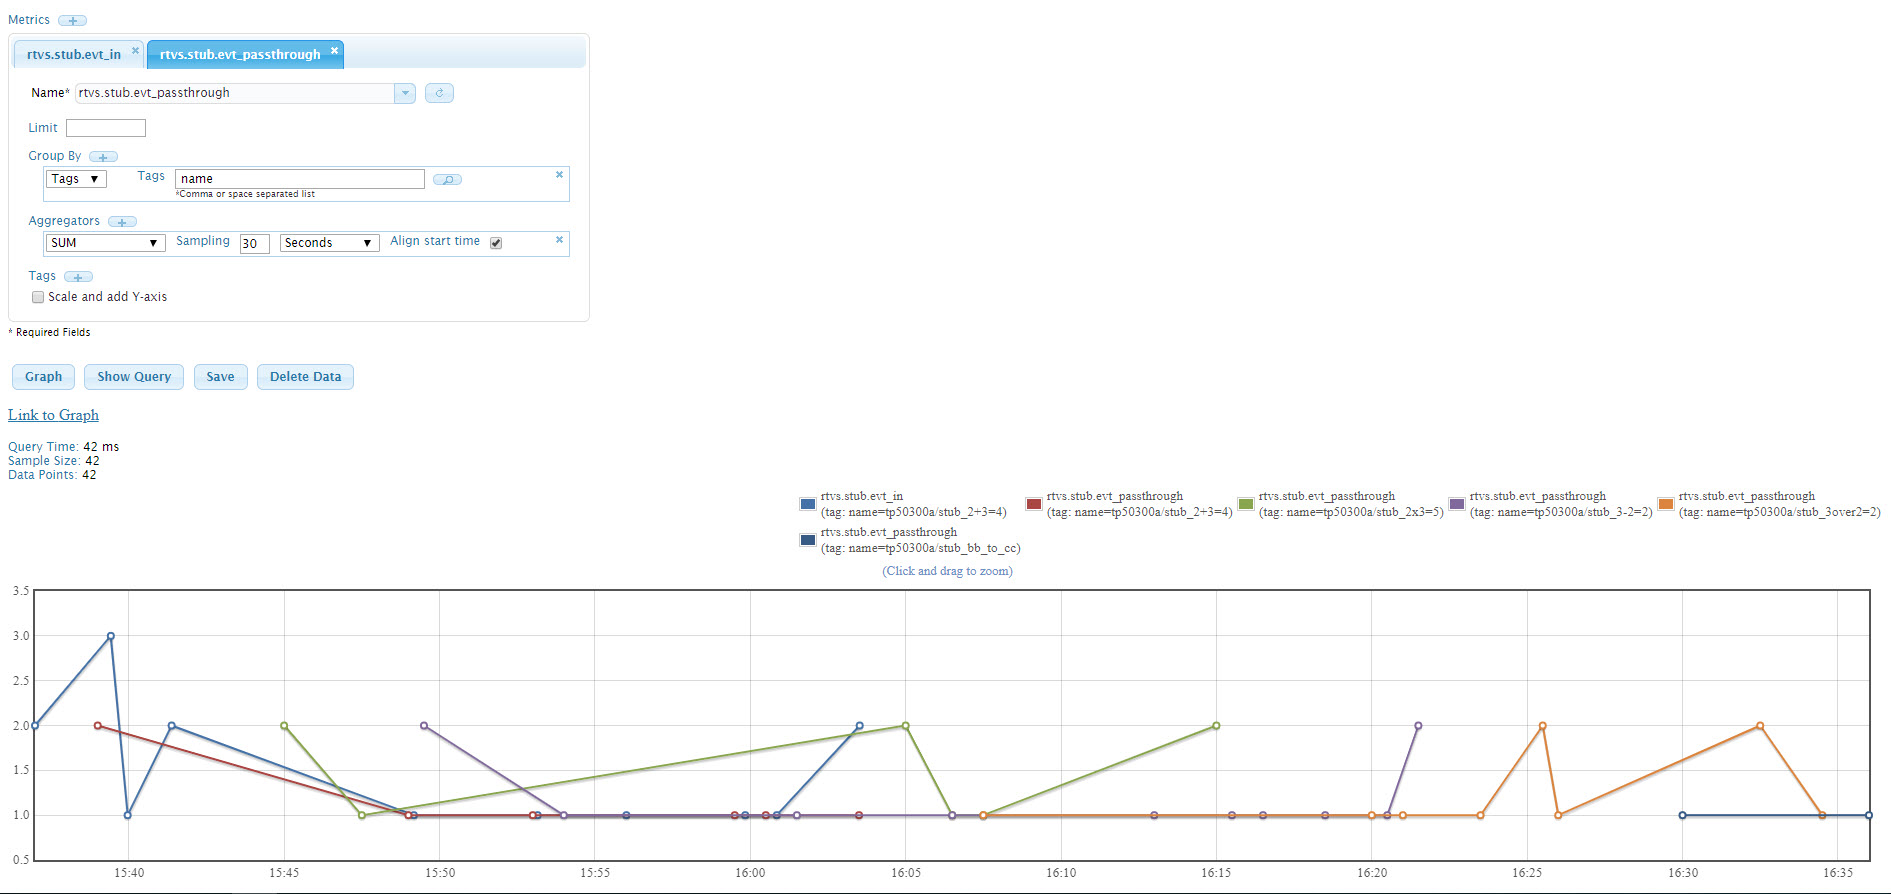
-
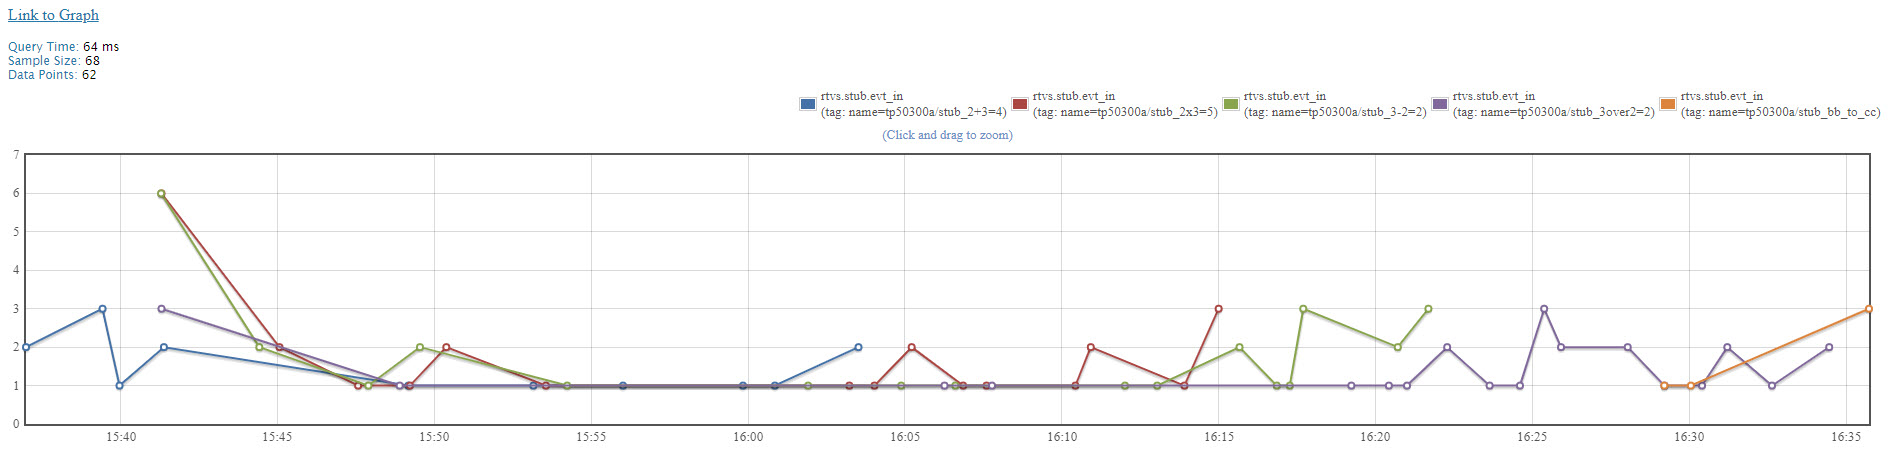
When you create a query with multiple stub metrics, the Scale
and add Y-axis field is displayed. Select this option to add
the Y-axis and scale the data series. An example graph is shown in Graph of the metrics query with scale and Y-axis
added. You can
compare the displayed graph to the graph in Graph of the metrics query to
see how the display differs because of the scaling and with the Y-axis
added.
Figure 21. Graph of the metrics query with scale and Y-axis added 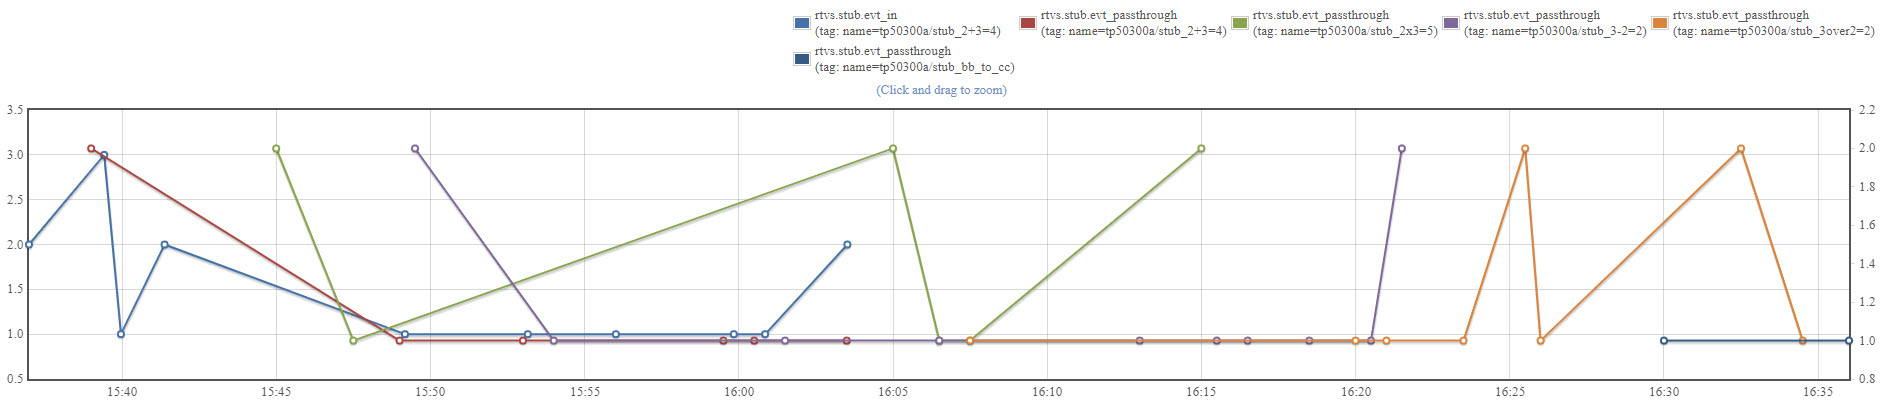
-
You can zoom in and enlarge part of the graph by clicking on the graph and
selecting an area you want to zoom in on as shown in View of the zoomed part in the graph.
Figure 22. View of the zoomed part in the graph 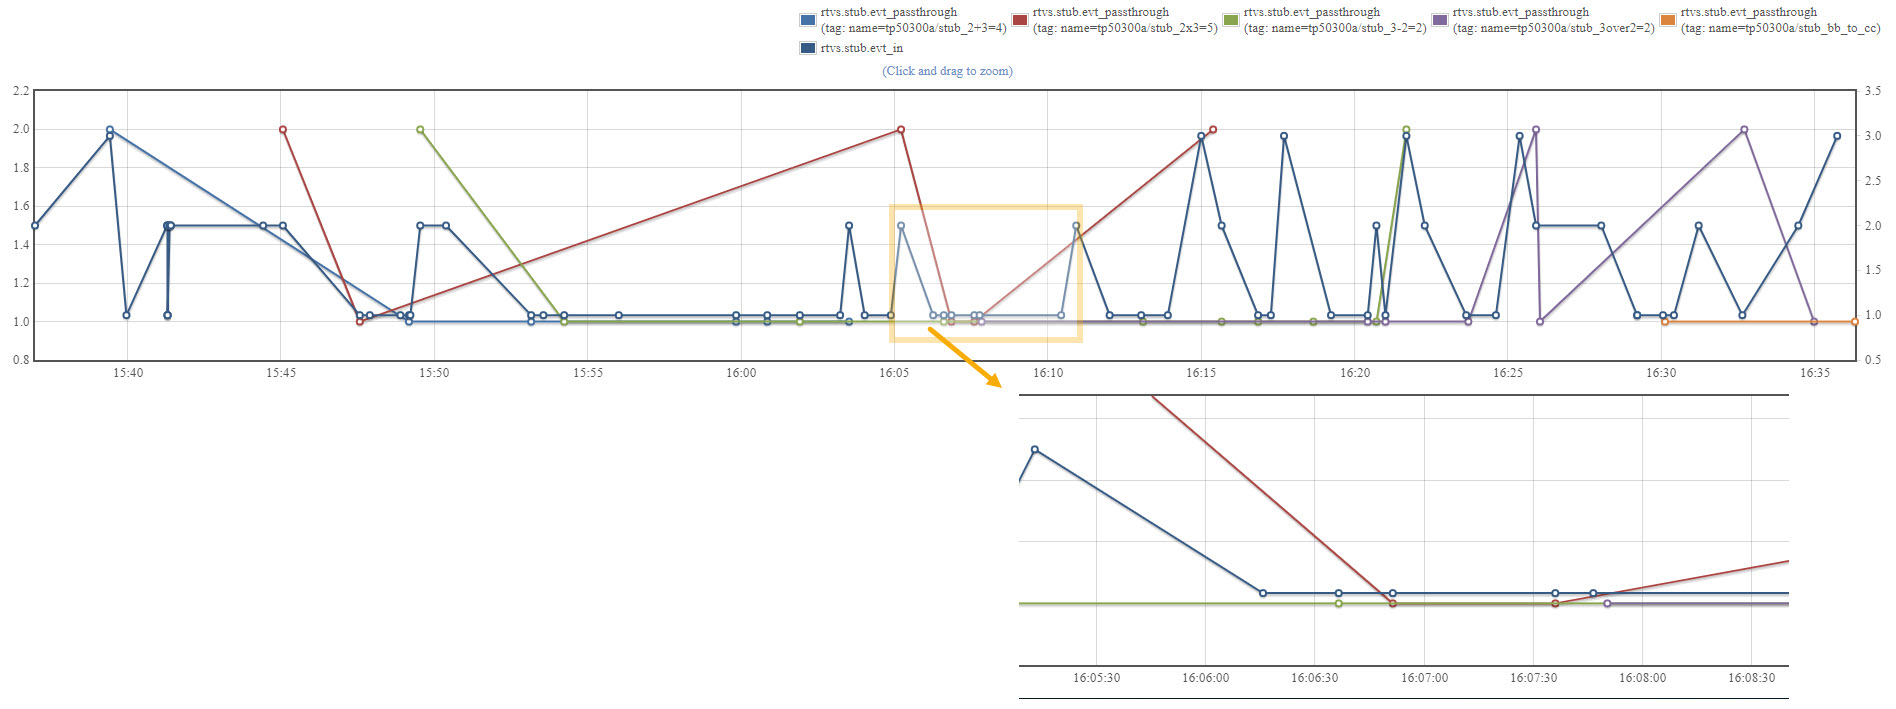
- To reset the graph to its original size, click Reset Zoom.
-
You can view the details of the data point by hovering over the data point
in the graph as shown in Hovering over a data point.
Figure 23. Hovering over a data point 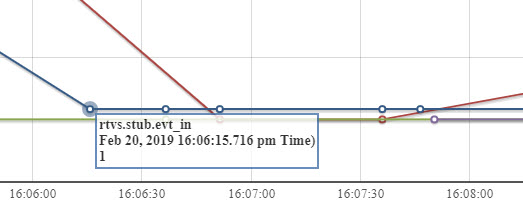
Using the link to the graph
You can create a link to the graph for your query by using the KairosDB UI so that others can use the link to view the graph.
Before you begin
- You must have created a query for the stub metric you are interested in.
- You must have created the graph for your query and is displayed in the UI.
Procedure
-
In the KairosDB UI, click Link to Graph.
The graph displayed in the KairosDB UI opens in a new browser window.
-
You can copy the link by right-clicking the Link to
Graph link in the KairosDBUI and use the context menu option, Copy link
address as shown in Using the context menu to copy graph link.
Alternatively, you can copy the link to the graph from the new browser
window.
Figure 24. Using the context menu to copy graph link 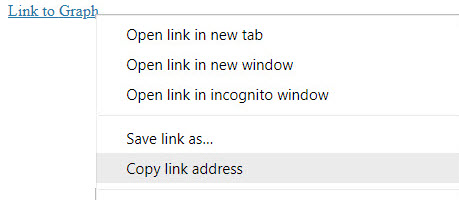
Results
The graph link can be used to directly view the graph in a browser.
Viewing and saving the query
After you create your query by using the KairosDB UI, you can view the query and save it to the local folder that you can use later to reload the query in the KairosDB UI.
Procedure
-
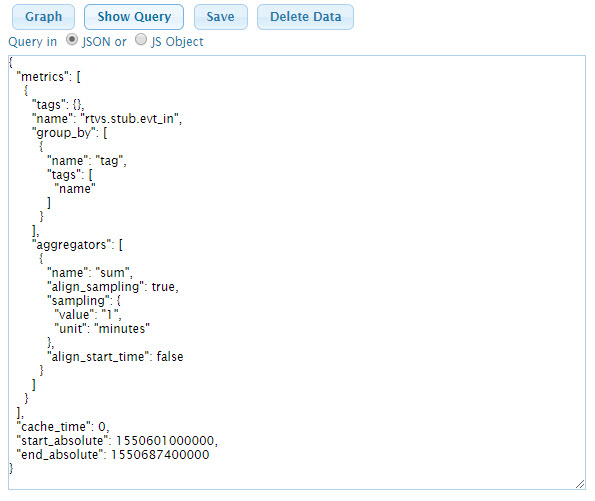
Click Show Query to view the query you created by
using the KairosDB UI. You can view the query in the JSON format or as a JS Object by
selecting the appropriate button in the displayed query.
The query is displayed as shown in the following sample.
-
To save the query to your local folder, click Save.
You can save the query as a CSV file or a JSON query text file by clicking the appropriate button in the dialog displayed.
- Navigate to the folder you want to save the file in, provide a name for the file, and then click Save.
Results
You can save your query as a JSON query text file that you can use later in the HTTP requests to get the data points and their values in the HTTP response.
What to do next
You can retrieve the data points from the KairosDB data store by using the HTTP requests, GET or POST.
Using the saved JSON request
You can use the saved JSON query with an HTTP POST or HTTP GET to retrieve the raw data points and their values from the KairosDB data store.
Before you begin
You must have saved the query you created as a JSON text file.
About this task
You can retrieve the metrics data points from the KairosDB data store by using the JSON query you saved. Apart from the HTTP request, you can also use the REST APIs to query the KairosDB to fetch details about the metrics, tags, metric data points, and so on. For more information about the KairosDB REST API, see KairosDB REST API.
Procedure
-
Use either of the following HTTP request types to request the KairosDB data store from a browser or test:
- HTTP POST
- HTTP GET
- Use the URL http://localhost:7828/api/v1/datapoints/query to send the request.
- For HTTP POST, place the JSON query in the body of the request.
-
For HTTP GET, there is no message body, the JSON query is appended to the
URL in the form of a query string. Encode the JSON query in HTML format as
shown in the following example:
http://localhost:7828/api/v1/datapoints/query?query=%7B%22metrics%22
Results
The response to the HTTP GET or HTTP POST request returns the data points and their values in the JSON format.