Viewing stub usage statistics
After you start stubs that are connected to Rational® Test Automation Server, and then run tests on the stub, you can view the stub usage statistics from the
Stub Usage page on Rational® Test Automation Server.
Before you begin
You must have completed the following tasks:
- Created stubs that use a transport for tests in Rational® Integration Tester and committed the test resources to the remote repository.
- Copied the third-party application libraries of the transport technology. See Copying third-party application Jars to Kubernetes.
- Started the stubs on Rational® Test Automation Server and ran tests on the stubs. See Starting a stub.
About this task
After you run the stubs, you can view details of the stub usage from the Stub Usage page on Rational® Test Automation Server.
Important: The settings that you configure (such as the
Period, From,
To, Query step) to view the
stub usage details are retained for you during your ongoing session and the
settings are retained even when you perform the following activities:
- You log out of the server and log in again.
- You log in after a server restart.
Procedure
-
Open your project on Rational® Test Automation Server.
The Overview page is displayed as the default page after you created the project and logged in subsequently.
-
Click Stub Usage.
The stub details are displayed as a graph. The default view displays the stub usage data that is gathered during the previous week and grouped in an hourly interval.
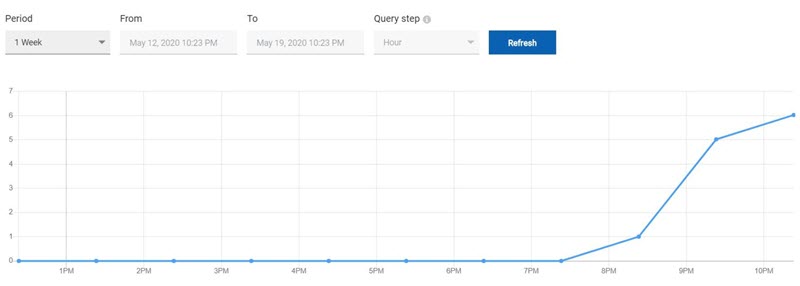
The metric data that is reported is for the number of calls that are received by a stub. These calls are requests, messages, or other calls that are received by the stub.
You can change the default view by selecting an option from the following options:Option Description 1 Week Displays the stub usage data that is gathered during the previous week and grouped in an hourly interval. Note: This is the default view.1 Year Displays the stub usage data that is gathered during the previous year and grouped in a daily interval. Range Displays the stub usage data that is gathered during the date range specified in the From and To fields. The data is grouped in the time interval that is selected from the Query step list. The options available for the time interval are as follows: - Minute
- Hour
- Day
- Week
- Month
- Year
Note: You can refresh the view at any time to present the graph for the latest data by clicking Refresh.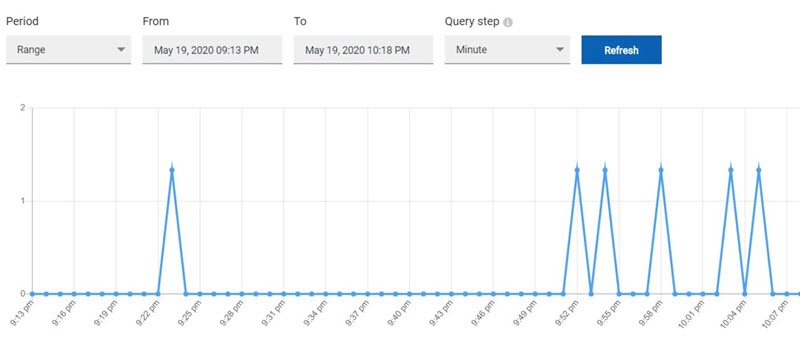
-
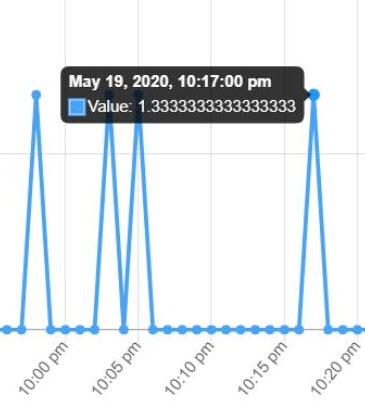
View details of the stub by hovering the mouse over any of the data-points to
view the stub details at that point.
The following details about the stub are displayed when you hover the mouse over the data-point:
- Date and time of the call received.
- Number of calls received.
Results
What to do next
You can perform any of the following tasks:
- You can view the routing rules defined in the stub. See Viewing routing rules.
- You can stop the stubs that are running on Rational® Test Automation Server. See Stopping a stub.