HCL OneTest™ API performance report
The HCL OneTest™ APIAPI performance report displays statistics of the sequence of the test run and timed sections defined in the tests.
The report contains the following pages.
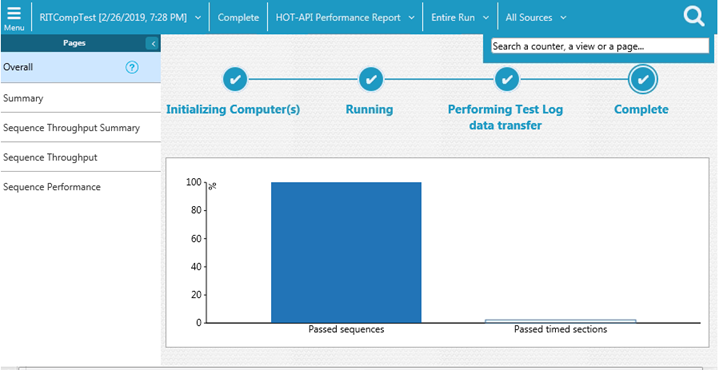
- OVERALL
- The Overall page provides this information:
- A progress indicator that shows the state of the run.
- A bar chart on the left shows the overall percentage of passed sequences for the entire run. A sequence corresponds to a test run.
- A bar chart on the right shows the overall percentage of passed timed sections, which are corresponding to individual sections within the steps of the tests.
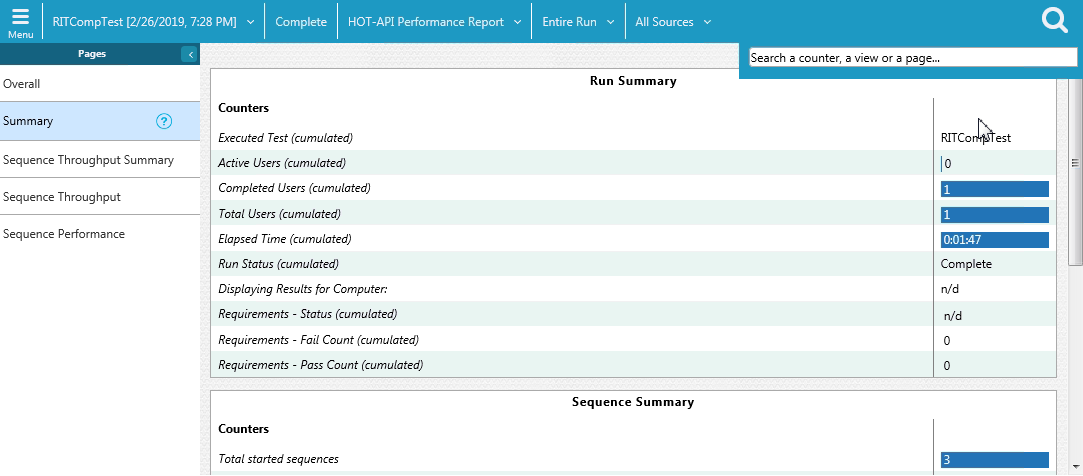
- SUMMARY
- This page displays information about the run:
- The number of users that are active and the number of users that have completed testing. This number is updated during the run.
- The elapsed time (run duration)
- The status of the run.
- The Performance Requirements: validates the performance requirements that you set in a schedule.
- The summary page also summarizes the data about the sequence run and timed
sections: Total number of sequences that were started and the total number
that have been completed, or failed, with a minimum and maximum rate.
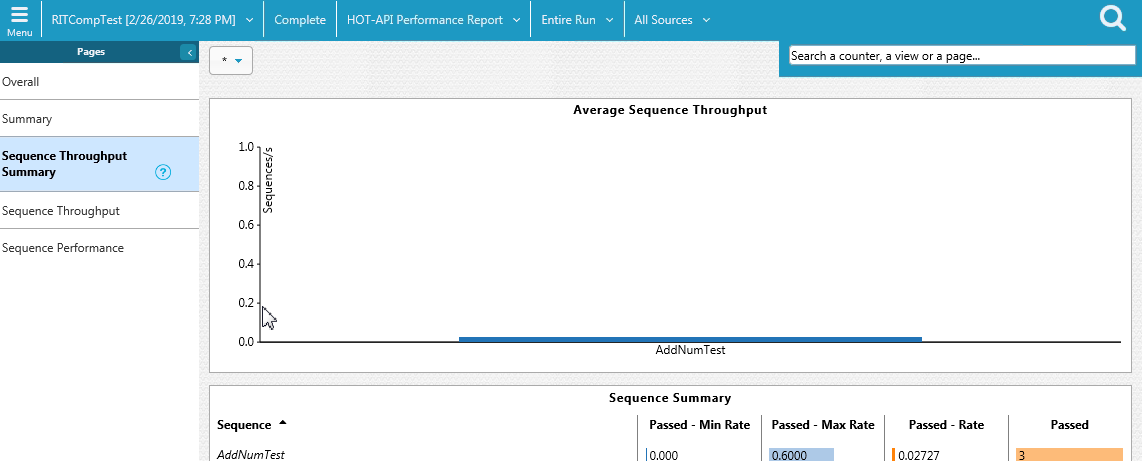
- SEQUENCE THROUGHPUT SUMMARY
- This page shows a bar chart of average throughput in seconds for each sequence.
- And if you add filters, you can see the timed sections throughput for each
sequence.
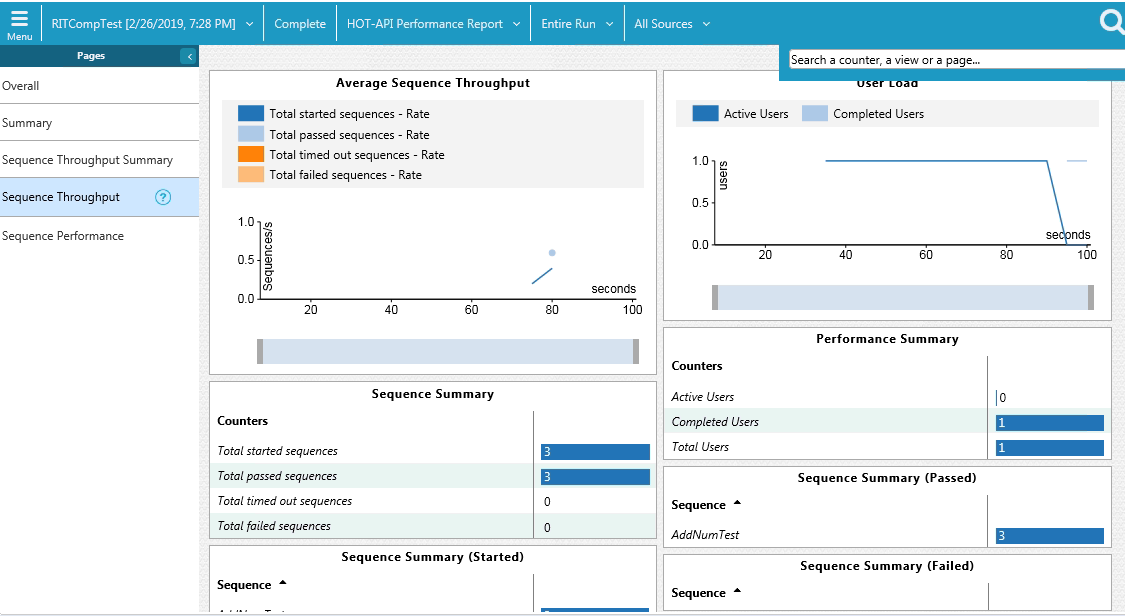
- SEQUENCE THROUGHPUT
- This page shows the average throughput for all combined sequences during the last recorded interval over the time period. Click on one of the Total rate boxed to have one graph displayed at a time or click Select All to see all rates on the same graph.
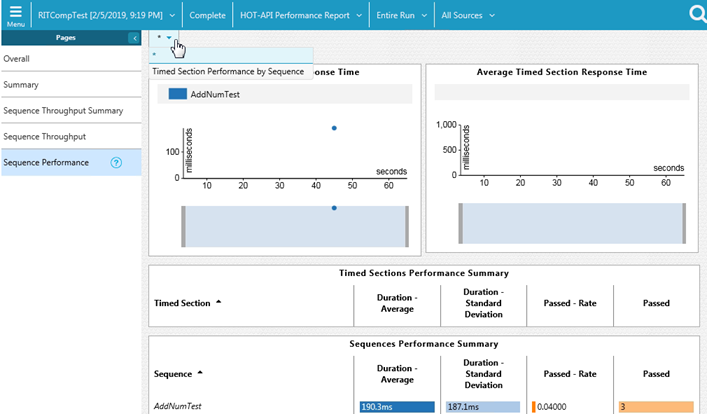
- SEQUENCE PERFORMANCE
- The chart displays the response time of the sequences as the test progresses. You can apply a filter to see the timed sections of all sequences or the timed sections of a particular sequence.
-