Customize the Performance Report
You can customize a Performance report.
- In
Windows:
<installation_directory>\IBM\TestRealTime\lib\reports
- In
Unix:
<installation_directory>/IBM/TestRealTime/lib/reports
Raw data
This template is made of three sections:
- The HTML section that is the common part of all reports,
- A JavaScript section that sets the tables and call graph depending of 2
variables dynamically initialized while the report is
creating:
var data = {{json}}; // the raw datavar d = new Date({{date}}) // the date of the generation
Raw data is composed of three sections at the top level:
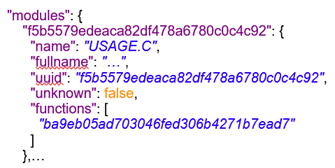
- The list of the modules, each of them has the following information:
- Name is the short name of the C file,
- Fullname is the name and path of the C file,
- uuid is a unique identifier of the module,
- unknown is set to true is the module is not part of the information you provided (there is only one unknown module that gathers all the function calls that are not in the known modules),
- functions is the list of the unique identifiers of functions of the module.
Modules are listed as hashmap with the uuid, as follows:
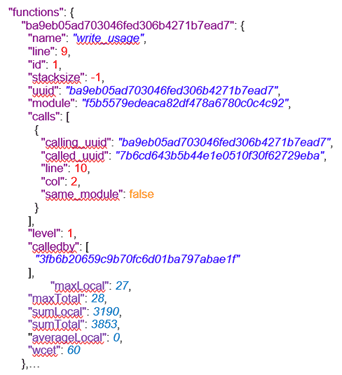
- The list of functions including following information:
- name is the name of the C function,
- line is the first line of the function in the module,
- id is the number used in .tsf file to identify this function,
- stacksize is the stack size computed during the execution if this option has been set (otherwise -1),
- uuid is a unique identifier of the function,
- module is a unique identifier of the module in which the function is declared,
- calls is the list of the calls in this function. Each of them
have the following information:
- calling_uuid is the unique identifier of the calling function,
- called_uuid is the unique identifier of the called function,
- line is the line number of the call in the module,
- col is the column number of the call in the module,
- same_module is set to true id the called function is in the same module that the calling function.
- level is a number that represent the level of the function in the call graph, starting to 0.
- calledby is the list of unique identifiers of functions that call this one.
- maxLocal is the maximum time spent in the function, excluding its descendants.
- maxTotal is the maximum time spent in the function, including its descendants.
- sumLocal is the time spent in the function, excluding its descendants.
- sumTotal is the time spent in the function, excluding its descendants.
- wcet is the Worst Case Execution Time of the function (this value is negative if it has not been calculated).
- Functions are listed as hashmap with the uuid, as following:

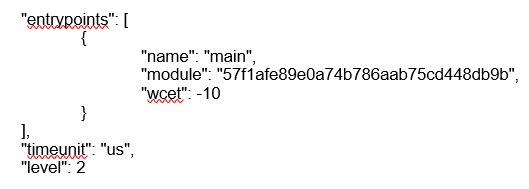
- The final section contains the following information:
- entrypoints is the list of entry points of the application;
each of them contains:
- name is the name of the entry points.
- module is the uuid of the module where is the entry point.
- wcet is the Worst Case Execution Time of the entry points (this value is negative if it has not been calculated).
- timeunit is the unit of time used in the report (us is for micro-second, ms for millisecond, s for second).
- level is the setting for performance (0 when there is no "compute F max + D max time", 1 when this option is not set to yes, 2 when it is set to yes + WCET).
An example of this section:
- entrypoints is the list of entry points of the application;
each of them contains: