Monitor shared memory
- The -g ses option outputs session information.
You can specify a particular session identifier after the ses keyword. If you do not include a session identifier, onstat -g ses outputs a one-line summary for each active session. Look for any session whose memory allocation or usage steadily increases.
- The -g mem option outputs statistics for a memory pool.
Internally, the database server organizes memory allocations into memory pools by duration. You can specify a particular pool name after the mem keyword. If you do not include a pool name, onstat -g mem outputs a one-line summary for each memory pool. To detect memory leakage, look for any pool whose memory allocation or usage steadily increases.
Monitoring memory is useful for tracking down memory leakage. Memory leakage occurs when memory remains allocated after the structure that holds its address was deallocated. There is no way to access the memory once its address is gone. Therefore, the memory remains with no way to remove it.
session                                      #RSAM     total       used
id      user      tty      pid     hostname  threads   memory      memory
24      informix   -         0     -         0         8192          5880
23      informix   -     13453     bison     1         6701056    6608512
8       informix   -         0     -         0         8192          5880
7       informix   -         0     -         0         16384        14344
6       informix   -         0     -         0         8192          5880
4       informix   -         0     -         0         16384        14344
3       informix   -         0     -         0         8192          5880
2       informix   -         0     -         0         8192          5880
ps auxw | grep 13453
Suppose also that your session is hooked to session 23 (the
italicized line in the preceding sample output).
ps auxw | grep 13453onstat -g memPool Summary:
name class addr
resident R a002018
res-buff R a118018
global V a18a018
mt V a18e018
smartblob V a192018
...
23 V a3e0018
24 V a3e2018
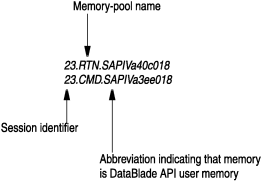
23.RTN.SAPI V a40c018
23.CMD.SAPI V a3ee018
...
| Memory-pool name | Associated memory pool |
|---|---|
| RTN | PER_ROUTINE |
| CMD | PER_COMMAND |
| STM | PER_STATEMENT (deprecated duration) |
| EXE | PER_STMT_EXEC |
| PRP | PER_STMT_PREP |
| TRX | PER_TRANSACTION (advanced duration) |
| UNK | PER_CURSOR (advanced duration) |
| SES | PER_SESSION (advanced duration) |
| SYS | PER_SYSTEM (advanced duration) |
onstat -g ufr 23 -r 30Memory usage for pool name 23:
size memid
2152 log
2016 ostcb
2600 sqtcb
8472 gentcb
1664 osenv
6392648 sqscb
792 filetable
112 rdahead
120 overhead
96 scb
416 sapi
3296 fragman
18808 opentable
280 hashfiletab
10056 temprec
592 GenPg
224 ru
56 sort
94848 rallocIn the preceding sample output, the main memory consumer is sqscb.
Any memory leakage from a DataBlade® API function would show up in the memid column entry labelled sapi. For more information about the onstat command, see the .