Interpretation of parameter analysis
You can find information about interpreting the details of each of the Machine Learning (ML) analyzers that analyze the parameters after certain tests are run in HCL DevOps Test Hub (Test Hub).
Parameters analyzed through ML
- The Response Time Lock-Step Pattern parameter.
- The Response Time Standard Deviation Pattern parameter.
- The Throughput Drop Pattern parameter.
- The Performance Agent Health parameter.
Test Hub analyzes the parameters based on certain criteria as detailed in Criteria for analysis of the parameters. The ML analyzers analyze the results of tests run in all projects in a team space for each of the parameters. The analyzers present their findings on each of the parameters as an insight on the Insights page in the project.
Details of the parameters analyzed
The details about the parameters analyzed are displayed on the Analyzers page in the team space.
| Column header | Description | ||||||
|---|---|---|---|---|---|---|---|
| Status | Displays the status of the parameter analysis as active or inactive in the team space. The default value of the analysis is set as active or enabled. | ||||||
| Name | Displays the name of the parameters that are
supported for ML analysis, which is as follows:
|
||||||
| Version | Displays the version of the ML analyzer. | ||||||
| Last Run | Displays the date when the tests were run for the analysis. | ||||||
| Unreviewed insights | Displays the number of insights into the specific parameter analyzed from different tests that are not reviewed by the project members. | ||||||
| Actions | Displays the following icons for the actions that you
can perform on each parameter analyzed:
|
You can click the Expand icon ![]() to view the details of the parameter analyzed.
to view the details of the parameter analyzed.
The Response Time Lock-Step Pattern parameter analyzer
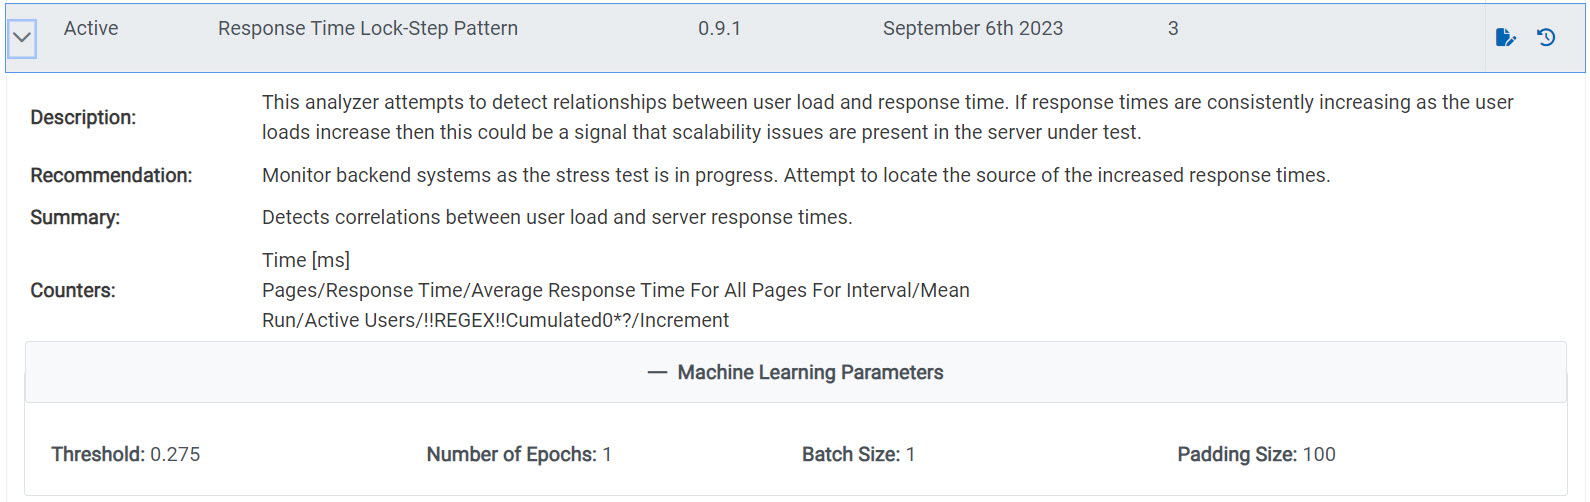
- The description of how the ML analyzer has attempted to analyze the parameter in the test.
- The methods to control the problems are provided as a recommendation.
- The summary of the analysis.
- The counters used in the analysis.
- The parameters used in the analysis.
The Response Time Standard Deviation Pattern parameter analyzer
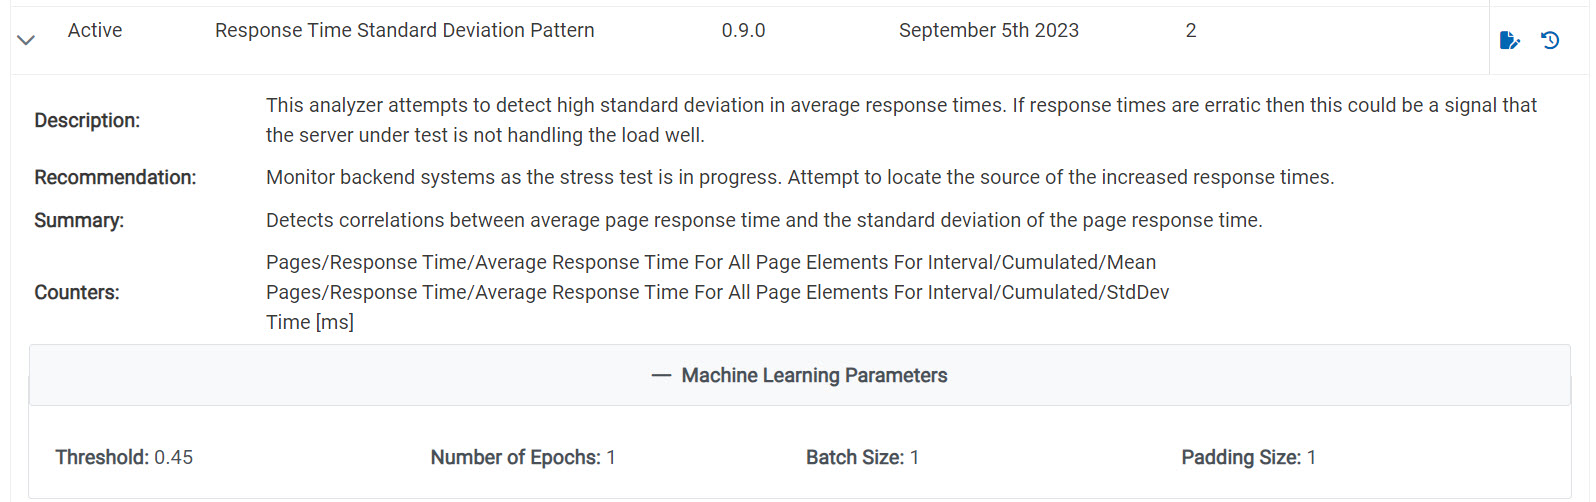
- The description of how the ML analyzer has attempted to analyze the parameter in the test.
- The methods to control the problems are provided as a recommendation.
- The summary of the analysis.
- The counters used in the analysis.
- The parameters used in the analysis.
The Throughput Drop Pattern parameter analyzer
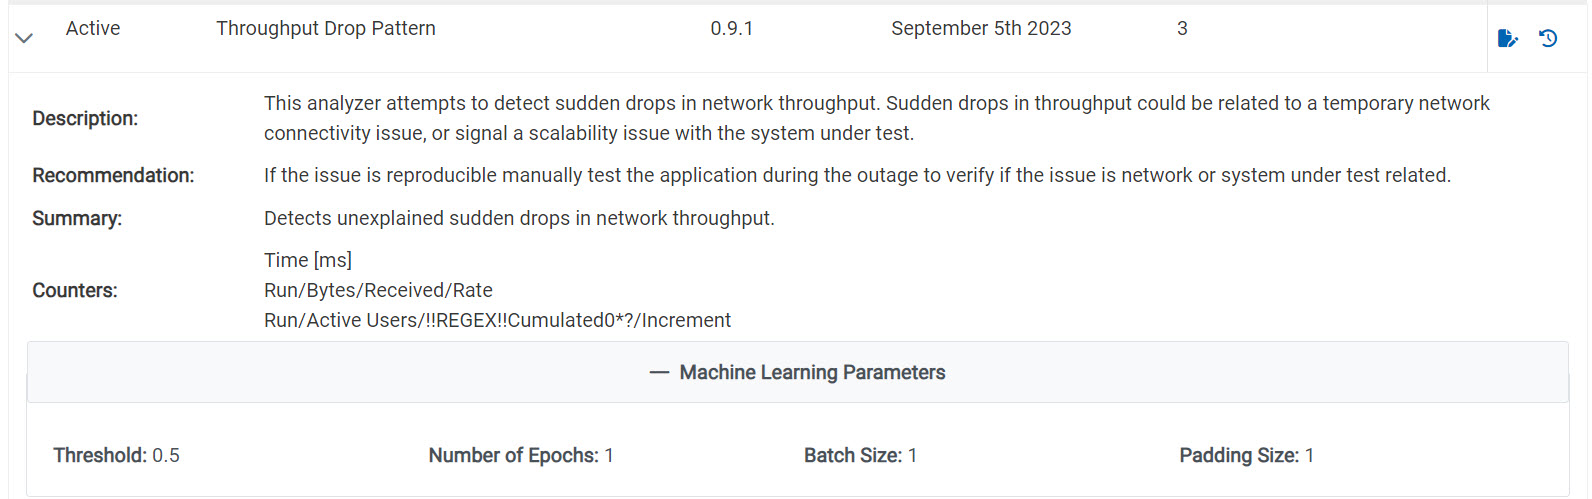
- The description of how the ML analyzer has attempted to analyze the parameter in the test.
- The methods to control the problems are provided as a recommendation.
- The summary of the analysis.
- The counters used in the analysis.
- The parameters used in the analysis.
The Performance Agent Health parameter analyzer
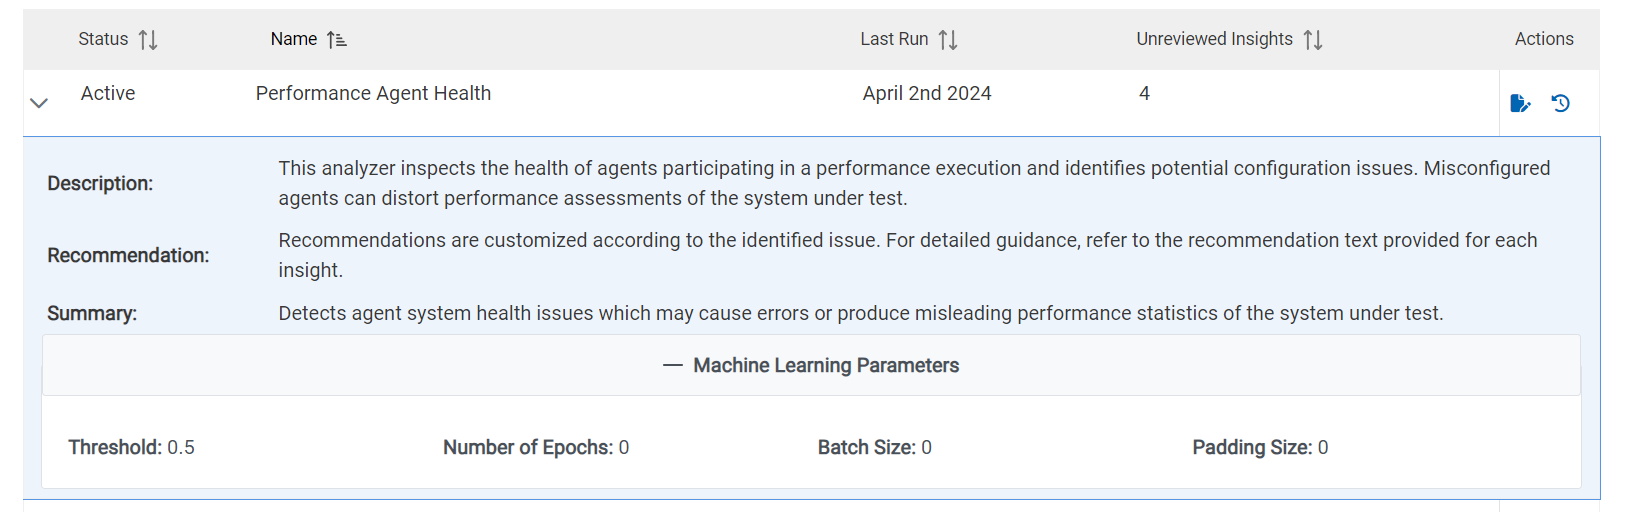
- The description of how the ML analyzer has attempted to analyze the parameter in the test.
- The methods to control the problems are provided as a recommendation.
- The summary of the analysis.
- The parameters used in the analysis.