Key Performance Indicators
Monitoring your system resources is a critical component to avoiding or in some cases, detecting HCL Commerce performance issues. As all systems are unique, it is recommended that you familiarize yourself with your system's baseline statistics. Assess and determine acceptable values for your system to proactively identify and address performance issues when they deviate from the baseline.
Key Performance Indicators (KPI) contain a number of critical metrics to provide context for the performance and health of the application. Any single metric by itself does not describe overall system health. In combination, they provide correlation and an overview of the application health.
Listed here are the top KPIs for HCL Commerce. The KPIs are organized in the topology tiers of web, application, and DB. They also include underlying System and Network subsystems that are applicable to all tiers.
Tip: More KPIs can be further defined for your implementation that best meet your business and IT requirements.
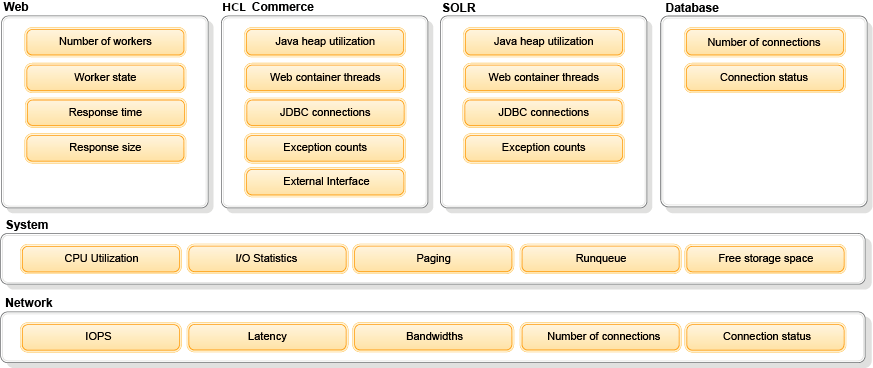
Web
The Web tier is the entry into the application. The KPIs listed here are applicable to both Web tier for HCL Commerce and the Search server.
| KPI | Description |
|---|---|
| Number of workers | There are limits to the number of workers that the web server can support at any point in time. |
| Worker state | Worker state describes if workers are actively processing requests, or if they are idle. |
| Response time | This metric reflects the response time of the completed requests. Response time depends on the content of your pages, browser, geographic location from which you have access and bandwidth. |
| Response size | This metric provides context to the response time, which can correlate to longer response times. Longer response time might correlate with larger response size. |
HCL Commerce and Search server
HCL Commerce application is located in here. Monitoring this tier provides a high-level overview of how busy the application is in addition to any potential exceptions.
| KPI | Description |
|---|---|
| Java heap utilization | Analysis of Java Heap utilization optimizes garbage collection (GC) which impacts the application's response time. CPU usage is therefore minimized. |
| Web container threads |
Web container threads provide visibility to the number of concurrent transactions which are served by the application. As each active thread consumes resources (both memory and CPU), it is important to monitor and tune web container threads. Monitoring threads helps the user discern the resources available for effective application use. If the active number approaches the maximum that is allowed, this can imply the application server is near its limit in terms of maximum concurrency. Tip: Because active threads consume resources, always monitor and tune web container threads along with the JVM GC and system CPU/memory. |
| JDBC connections |
Similar to web container threads, JDBC connections show number of connections to the database. The key metrics to monitor here are the active connections. |
| Exception counts |
The exception counts is a data point to monitor for trend. Ideally, this count is 0. It is a good practice to monitor the relative exception count for the application and use it to identify issues that are introduced by new code or a specific user path. |
| External interface |
All external interface requests should be monitor for their responsiveness for example, number of, response time, and size of requests. It is useful to understand the external interface’s contribution to a user request response time. |
Database
The application persists data on the database as a data store. The health of the database can have a direct impact on the application.
| KPI | Description |
|---|---|
| Number of connections |
The number of connections provides visibility to number of active connections to the database. |
| Connections status |
Connection status provides details of each connection. Due to JDBC connection pooling, there might be many idle connections. The running status provides insight into the concurrency to the database. |
System
The system metrics are related to the OS, and tied to the hardware. As all application tiers sit on top of the OS, it is critical to monitor the health of the system to provide context of the application tier information.
| KPI | Description |
|---|---|
| CPU utilization |
Monitor and ensure that CPU usage percentages are within the expected range for the system. Tip: CPU usage subdivisions such as User/System/Idle/Wait provide extra insight into which part of the system the CPU is busy with. |
| Paging | Monitor memory counters along with disk counters when performance problems are suspected within your system. |
| Runqueue | Monitor for effective thread scheduling. |
| Free storage space | Monitor the amount of free storage space or disk usage on your system and monitor the trend of disk usage to avoid server downtime, server failures, and data loss. |
Network
| Kpi | Description |
|---|---|
| Latency |
Increased latency can indicate that the network is busy. This might mean that the number of packets, which are transmitted exceeds the capacity of the network. The network's complexity and number of hosts or gateways can also affect latency. |
| Bandwidths |
Monitor and ensure that the network bandwidth is sufficient for the application workload. A limited bandwidth might mean limited application throughput as the application cannot drive more data. |
| Number of connections |
Monitor number of connections to each system. Network connection can be an early warning indicator for a system overload. |
| Connections status | Network statuses help describe the connections to each system. |