Viewing Fixlets and Tasks
To display a Fixlet or Task,
- From the navigation tree in the Domain Panel, click the icon labeled Fixlets and Tasks.
- From the resulting List Panel on the right, click an item to open it.
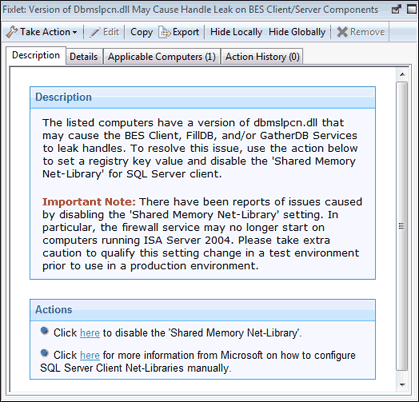
The body of the Fixlet message is shown in the Work Area (click the Description tab if not already selected).

When selected, each Fixlet or Task has a window of its own.
Each Fixlet or Task comes with four tabs in the Work Area:
- Description: This is a page providing a descriptive explanation of the problem and one or more Actions to fix it. The Actions are represented by links at the bottom of the description page. Click an Action to open the Take Action dialog, which allows you to further target or schedule the Action. If you accidentally click an Action hyperlink, before the actual deployment, you always get a chance to modify (or cancel) the Action.
- Details: This dialog contains the Fixlet/Task properties such as category, security ID, download size, source, severity, and date. It also lists the code behind the Relevance expressions and the Actions. At the bottom of this dialog there is a text box for you to enter a comment that remains attached to this item.
- Applicable Computers: This is a filter/list of all the computers targeted by the selected Fixlet or Task. You can filter the list by selecting items from the folders on the left, and sort the list by clicking the column headers.
- Action History: This is a filter/list of any Actions that have been deployed from this Fixlet or Task. If the item is new, there are no Actions in the list. Like the other filter/lists in the Console, you can filter the Actions using the left panel, and sort them by clicking the column headers above the right-hand list.
