Filtering from the Assessment Summary view
When a scan completes, you can look at its findings in the Assessment Summary view (this view opens by default in the Triage perspective). In this view, you can create a filter from the bar chart.
About this task
Note: Filters that are applied outside of the Vulnerability
Matrix view may not affect the Vulnerability Matrix view. The Vulnerability
Matrix view Show the counts of filtered findings toolbar
button must be selected for the filter to be reflected in the Vulnerability
Matrix view.
Note: In
AppScan® Source for Development (Visual Studio plug-in), this view is part of
the Edit Filters window.
Procedure
- In the Assessment Summary view, change the graphical representation
to suit your needs. For example, given an assessment that includes
Validation.Required,Validation.EncodingRequired, andCryptography.PoorEntropyvulnerability types, set the Chart Property to Vulnerability Type. This will display the findings by vulnerability type in a bar chart representation: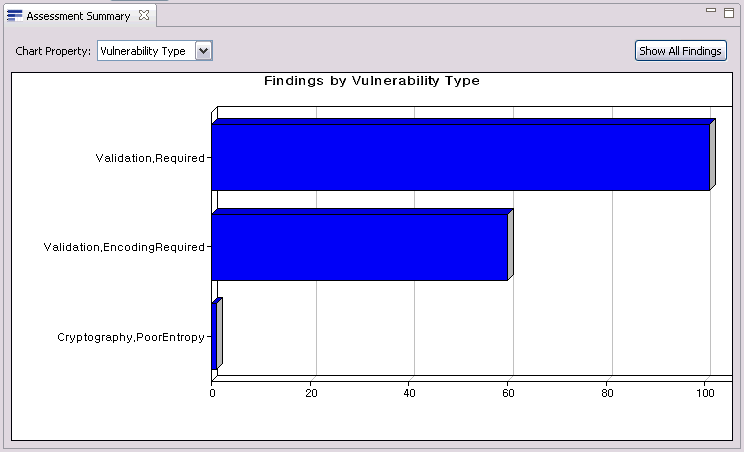
- To create a filter of
Validation.Requiredvulnerability types, click theValidation.Requiredbar in the chart.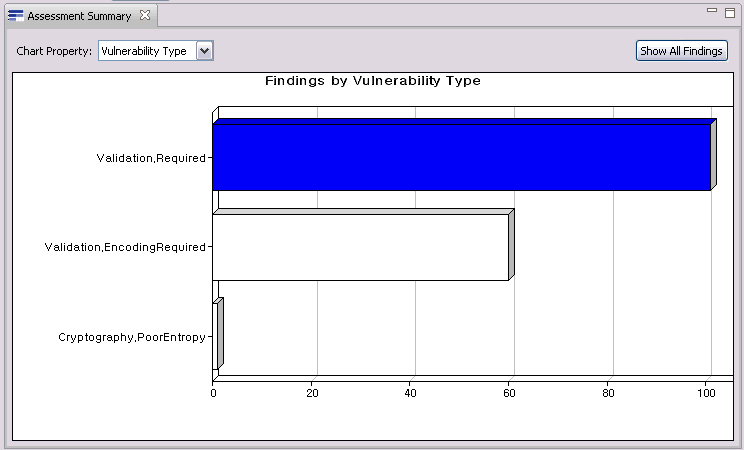
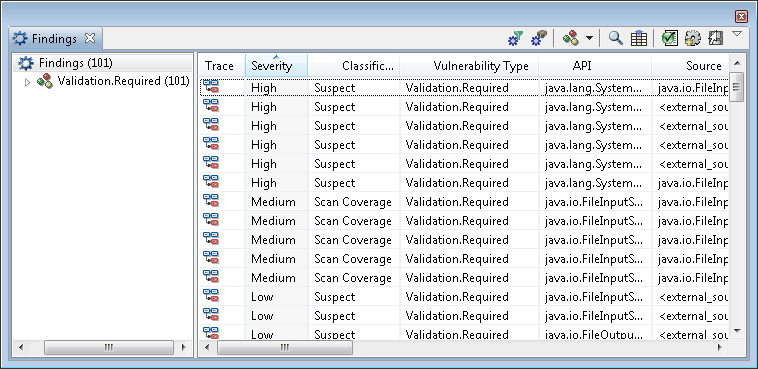
Tip: Hold the mouse over the bar to see the number of vulnerabilities.The filtered results appear in the findings table:
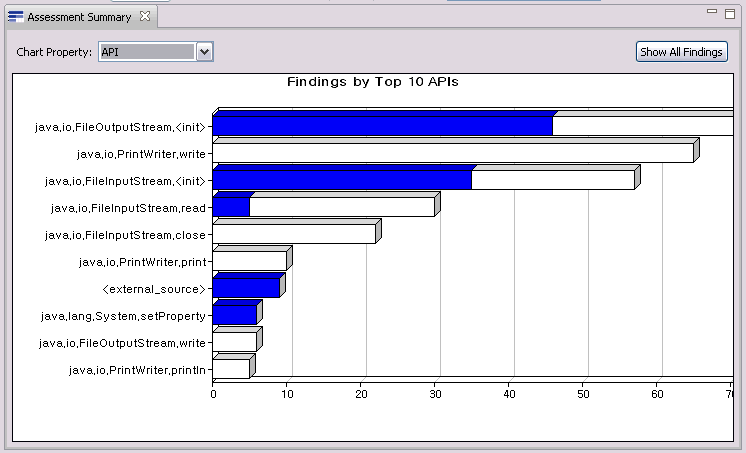
- To view the same filter results by API, set the Chart
Property to API: