Production topology example
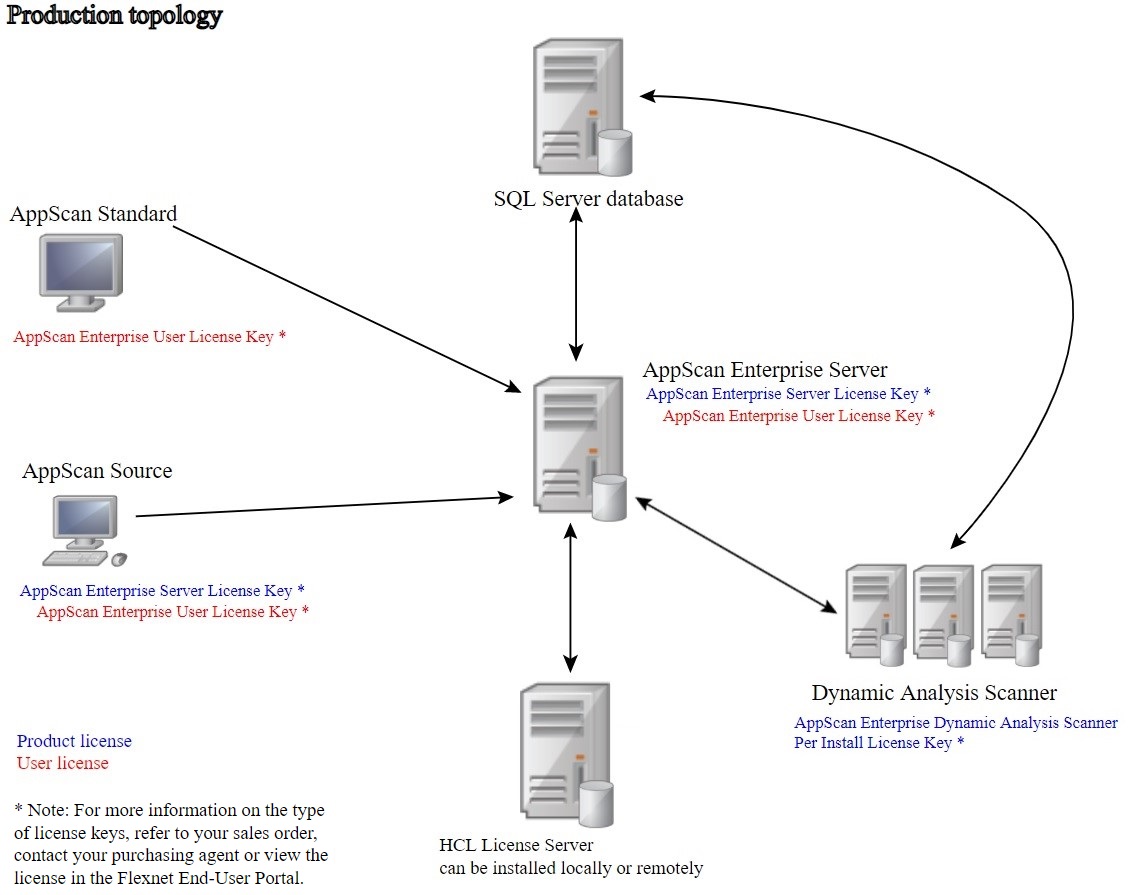
This enterprise topology example is useful for production or medium-sized teams and multiple server deployments. In this type of installation, databases are installed on a single database server and each application is installed on a dedicated application server. You can install multiple instances of an application on separate application servers.
Improved traffic performance for DAST scanning
Architecture changes made in AppScan® Enterprise 8.7 to enhance scalability and performance decreased the traffic between the Dynamic Analysis Scanner (DAST scan server) and the SQL Server database, and increased the amount of data stored locally on the scan server.
In earlier versions of AppScan Enterprise, the DAST scan server wrote data into the central database throughout the entire duration of the scan. This consumed a lot of resources on the database server, which affected the Web UI performance and greatly limited the number of scans that could run simultaneously on a scan server. There were also latency concerns depending on where the scan server was located in relation to the database server.
As of AppScan Enterprise version 8.7, scan data is now written into a local built-in database on the DAST scan server. At the end of the scan, data is transferred to the central SQL Server database which resides on the AppScan Enterprise Server. The increase in network traffic between the scan server and the target application reduces the network bandwidth between the scan server and the database. This improves the performance of the Web UI, enables organizations to run more simultaneous scans on a single scan server, and addresses the latency concerns when the scan server is located far from the database server.
Network traffic benchmarks for AppScan Enterprise DAST scanning
The following benchmarks are based on a dynamic analysis scan of a test website 'Altoro Mutual' (demo.testfire.net). The web application is hosted in Texas, USA; the DAST scan server and the SQL Server database are hosted in Ottawa, Canada. The test scan was completed by AppScan Enterprise 8.7 in 41 minutes, covered 688 pages, and included 21,068 unique security tests.
- Windows™ 2008 R2 SP1
- 4 CPU 16G RAM
- Microsoft™ SQL Server 2008 R2 (SP2), 10.50.4000.0 (x64)
- Windows 2008 R2 SP1
- 2 CPU 4G RAM
| Server | Total bytes | Bytes sent | KB/second sent | Bytes received | KB/second received |
|---|---|---|---|---|---|
| SQL Database Server | 167,471,086 | 81,546,724 | 258.6 | 85,924,362 | 272.5 |
| DAST Scan Server | 329,359,220 | 112,187,145 | 355.8 | 217,172,075 | 688.8 |
| Web Server | 161,890,890 | 135,628,107 | 472.5 | 26,262,783 | 91.5 |
The total traffic usage between the SQL Database Server and the DAST scan server is 81,546,724 (Bytes sent) +85,924,362 (Bytes received) =167,471,086 bytes.
The total traffic usage between the DAST scan server and the Web Server is 135,628,107 (Bytes sent) +26,262,783 (Bytes received) =161,890,890 bytes.