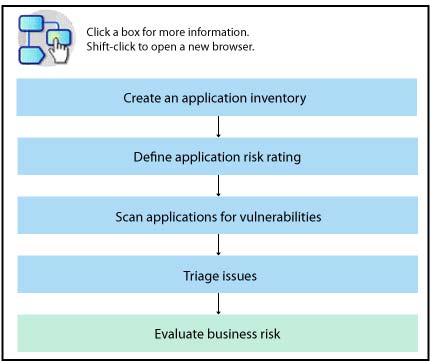
Evaluating business risk using dashboards

Use the dashboard to track various metrics and trends of the applications that compose your portfolio.

Click this area to get information about creating an application inventoryDetermining riskClick this area to get information about scanning applications for vulnerabilitiesClick this area to get information about triaging issues

Before you begin

  1. To see the trend charts, make sure that your product administrator gives you the 'View Trends' user permission.
  2. When you use Microsoft™ Internet 8.0, you must install Microsoft Silverlight before you can use the charts. Consider upgrading to a newer browser version or change to Mozilla Firefox so that you can take advantage of the interactivity of this feature.

Procedure

  1. Go to the Dashboard tab to begin your triage process.

  2. In the black banner area, select a particular business unit from the drop-down menu to fine-tune the display, or analyze the portfolio in its entirety. Click the What's this? link to understand how the security risk rating works.
    Tip: Based on your selection from the Business Unit menu, the banner area of the dashboard (black area) displays the number of applications that fall into each security risk rating category. The metrics in this area of the dashboard are not affected by the chart that is selected in the lower section (white area).
  3. Select a chart to analyze.
    Note: Trend data is kept for 24 months, ending with the current month. Historical data accumulation begins with the month that you first start to use AppScan Enterprise v9.0.2 or higher. Trend data aggregates the dates that use the timezone information of the computer that hosts the Liberty Server. To maintain integrity of the data, the dates that are displayed here remain in the timezone in which they were captured, and do not reflect the timezone of your locale.
  4. To navigate into the charts by using the keyboard, press the tab key until the focus is on the chart.
    1. Press the right arrow key to enter the chart, and press the down arrow key to focus on the axis of the chart.
    2. Use the down and up arrow keys to move between the axes of the chart. You can use the right arrow key to enter the elements of an axis, and use the left arrow key to return to the axis.
      Note: Key summary:
      • Enter a chart: Right arrow, down arrow
      • Navigate areas of a chart: Up and down arrow
      • Enter an area of a chart: Right arrow
      • Leave an area of a chart to move up a level: Left arrow
  5. Apply advanced filtering.
  6. Export data for the selected business unit or the entire portfolio to Excel () for offline analysis.

What to do next

Filter your application portfolio