Single scan view
This view collects together all the data for a specific SAST scan, including all executions of the scan.
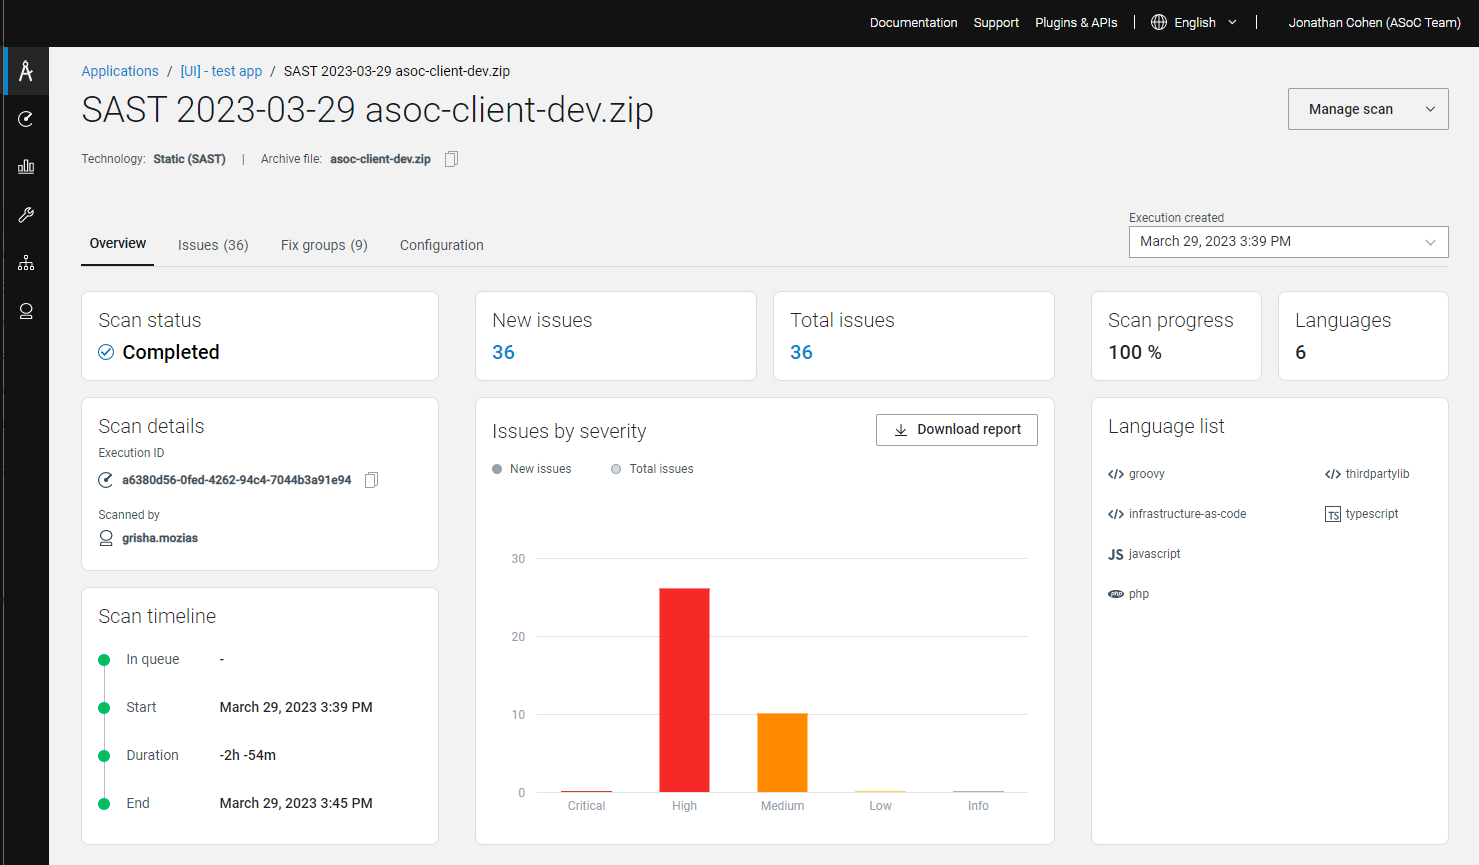
General
The upper area shows the scan name. Select the specific execution of the scan to view from a drop-down list by date .
Overview
For the selected scan execution, this tab displays:
- Details: Status, start and end dates, scanned by, and duration and number of new and active issues.
- Coverage: Number of visited pages and tested elements
- Issues by Severity chart
- Execution logNote: The log pane shows only the latest section of the log. To see the whole log, click the Download link.
Possible scan statuses are:
- Initialized: You started the scan and it will start running within a few seconds.
- Running: Scan in progress.
- Completed: Scan completed successfully.
- Failed: Scan failed.
Issues
For the selected scan execution, this tab displays a list of all active and non-complaint issues by default. Filters are available, and the columns shown can be selected from the drop-down list.
Fix groups
For the selected scan execution, this tab displays the fix groups for the issues found.
Configuration
For the selected scan this tab displays the configuration details.