Format of the Unica Insights Reports
Use the styles included with the global report style sheet, GlobalReportStyles.css, to format the report page.
| Item | Style |
| Text | Tahoma font |
| Report title text | Tahoma 18 point |
| Page footer text | Tahoma 8 point |
| Field Set labels | Tahoma 8 point |
List report styles
Use the styles included with the global report style sheet, GlobalReportStyles.css, to format list reports. The following table shows formatting from the GlobalStyleSheet.css style sheet for list reports.
| Item | Style |
| Cells | 1 px silver line(#c8c8c8) borders (unless otherwise noted) |
| Column header | Light gray background(F5F5F5); 2px Grey(#c8c8c8) line separates column header from rest of table |
| Summary header rows (list headers) | Light yellow background |
| Total row at bottom | Dark gray background; 2px Grey line separates row from rest of table |
| Item | CSS class name | Style |
| Page - Header | Ph |
font-family: “Tahoma”; font-size: 18pt; font-weight: bold; |
| Page - Footer | Pf | padding-top:10px; font-size:8pt; font-weight:bold; |
| Table - List column title cell | Lt |
text-align:left; border: 1px solid #c8c8c8; background-color: #f5f5f5; background-image: none!important; font-weight:normal; vertical-align: top; padding: 10px 20px; font-family: “Tahoma”; color: #444444; font-size: 14px; |
| Item | CSS class name | Style |
| Table - List column body cell interior | lci |
border: none; background-color: F5F5F5!important; text-align: right; padding: 3px 5px; vertical-align: middle; |
| Table - List column body cell | lc |
border-top:1px solid #C8C8C8; border-bottom:1px solid #C8C8C8; border-left: 1px solid #C8C8C8; border-right:1px solid #C8C8C8; padding: 3px 5px; text-align: left; vertical-align: middle; font-family: “Tahoma”; |
| Table - List column body measure cell | lm |
vertical-align: top; border:1px solid #c8c8c8; border-right: 0; border-left: 0; padding: 3px 5px; text-align: right; |
| Crosstab - Totals first row | tr |
border-left: 2px solid black; background-color: #f5f5f5 !important; font-weight: bold; padding: 3px 5px; |
|
Complex table total -new class added |
ctth |
color: #444444; background-color: #f5f5f5; border-bottom:2px solid #c8c8c8; padding: 3px 5px; border-left: 2px solid #c8c8c8; |
| Table totals row | ttr |
color: #444444; font-weight: bold; background-color: #f5f5f5; padding: 3px 5px; |
| Table totals row | ctr |
color: #444444; font-weight: bold; border-left:2px solid #c8c8c8; background-color: #f5f5f5; border-bottom:1px solid #c8c8c8; |
| Table totals header | cth |
color: #444444; border-bottom:2px solid #c8c8c8; border-left:1.5px solid white; border-right:1.5px solid white; font-weight: 100; |
| List - Inner header cell | ih |
border-top:1px solid #c8c8c8; border-bottom:1px solid #c8c8c8; padding: 3px 5px; vertical-align: middle; |
| List - Outer header cell | oh |
font-weight: bold; vertical-align: top; border: 1px solid #c8c8c8; border-right: 0; border-left: 0; padding: 3px 5px; word-break:keep-all; background-color: #f5f5f5; |
| Item | CSS class name |
Style |
| Outer header cell with top border | ohl |
font-weight: bold; vertical-align: top; background-color: #ddd; padding: 3px 5px; word-break:keep-all; border-top:2px solid black; border-left:1.5px solid #c8c8c8; border-right: 5pt solid #c8c8c8; border-style:solid; border-bottom:none; |
| Crosstab | xt |
border: 2px solid #C8C8C8; color: #444444; empty-cells: show; font-size: 16px; |
| Crosstab - Member label cell | ml |
font-style: normal !important; color: black; font-weight: 300; height: 30px; border-left: none; border-right: none; border-bottom:1px solid #c8c8c8; |
| Crosstab - Member label cell | cht |
vertical-align: top; background-color:transparent; padding: 3px 5px; text-align: left; |
| Crosstab - Member value cell | mv |
vertical-align: top; white-space: nowrap; border: 1px solid #c8c8c8; padding: 3px 5px; text-align: right; border-left:none; border-right:none; vertical-align: top; white-space: nowrap; padding: 3px 5px; text-align: right; |
| Field set | fs |
display: -moz-inline-block; display: inline; text-align: left; f ont-size:8pt; margin-bottom: 15px; color : #444444; |
| Chart | ch | border:1pt solid #c8c8c8; |
| Chart - Title | ct | font-weight:bold; |
| Chart - Axis labels | al | font-size:10pt; |
| Chart - Axis title | at | font-weight:bold; text-align:center; font-size:10pt; color:#444444; |
| Item | CSS class name |
Style |
| Chart - Chart Palette | In XML Report Specification |
Before the closing chart tag
( |
| Hyperlink | .hy |
color: #037bbf; font-size: 14px; font-family: “tahoma”; |
| Totals first Column | tf |
border-left: 2px solid black; background-color: #f5f5f5 !important; font-weight: bold; padding: 3px 5px; |
| Complex table total | ctt |
color: #444; background-color: #f5f5f5 !important; border-left:2px solid black; border-bottom: 1px solid #c8c8c8; padding-left: 5px 5px; |
| Complex table total row | cttr |
color: #444444; background-color: #f5f5f5; font-weight: bold; border-bottom:1px solid #c8c8c8; |
| List | ls |
border: 1px solid #c8c8c8; color: #444444; empty-cells: show; margin-top: 10px; font-size: 14px; |
| Hover selection class | hoverSelection | background-color: transparent !important; color: #444444 !important; |
Additionally, when you create a new list report, use the following guidelines to match existing reports:
- Use List Headers (not List Footers) to display summarization at the object level.
- Manually right-justify any numbers that are displayed in List Headers. Unlike List Footers, List Headers are not separated into the outer component and summary component, which use a right-justified style by default. When you summarize information into a List Header, you must complete the extra step and right-justify the values.
- Optionally, add 2px solid Grey borders to group columns.
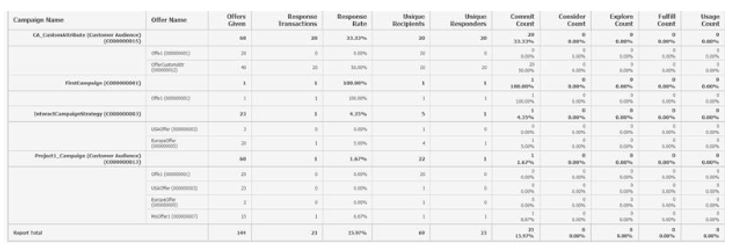
The following example shows a list report that does not use the global styles:
Date formats for English versions
If you use a globalized version of the HCL Unica reports package, you see a different date format in your list reports depending on which locale you use. Unica Insights list reports use the date style medium.
The following table shows the date formats for list reports for all available locales.
Unica Insights list reports date formats for globalized versions
| Locale | Unica Insights list reports date format example |
| English | Apr 1, 2020 |
Crosstab report styles
Use the styles included with the global report style sheet, GlobalReportStyles.css, to format crosstab reports.
The following table shows formatting from the GlobalStyleSheet.css style sheet for crosstab reports:
| Item | Style |
| Cells | Light Grey (#f5f5f5) background; 1 px silver line borders |
| Measure cell (upper left) | 2 px Grey (#C8C8C8) line separates the cell from the rest of the crosstable |
| Outer level totals | Gray/offwhite background |
Additionally, when you create a new list report, use the following guidelines to match the existing reports.
- Use 2px grey borders to separate summarization from measures.
- Use 2 px grey borders to group logical column groupings.
- As a general guideline, avoid summarizing both columns and rows in the same report.
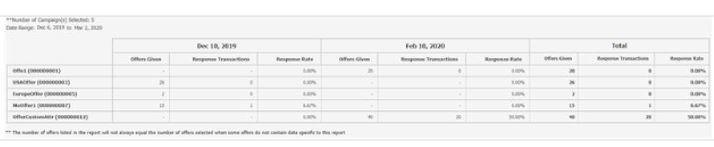
The following example shows a crosstab report that uses the global styles and has 1.5 px borders that are applied to show column groupings.
Chart styles
Use the styles included with the global report style sheet, GlobalReportStyles.css, to format charts.
The following table shows formatting from the GlobalStyleSheet.css style sheet for charts:
Charts obtain the following formatting from the GlobalStyleSheet.css.
| Item | Style |
| Charts | 1 pt light gray border |
| Titles and labels | 10 point bold font |
Additionally, when you create a new chart, use the following guidelines to match the existing chart reports.
- Use the default width, unless there is more than one chart on the report. When you include multiple charts in a single report, set the chart width to 750px.
- To use gradients and color palettes, copy and paste the strings from the table in “Global report styles” into the XML report specification.
- As a general guideline, select the chart type based on the data that you expect
to be returned.
- Use line graphs as the chart type only when you can guarantee the report retrieves continuous data.
- If there are multiple series, a stacked bar works better than a non-stacked bar.
- As a best practice, use percentages only when the total percentage equals 100%. Pie charts tend to confuse people when the values do not add up to 100%.
- If there are only two series on a chart and you display both the Y1 and Y2 axes, as a best practice you must match the colors to the first two palette colors for the axis labels.
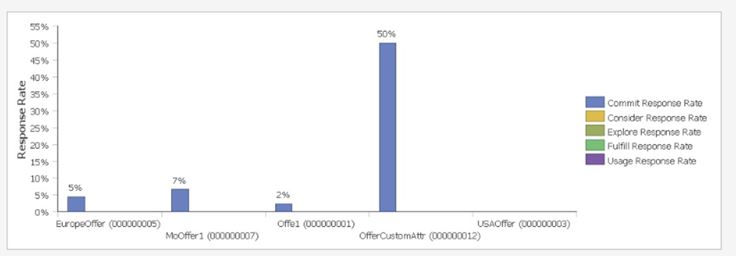
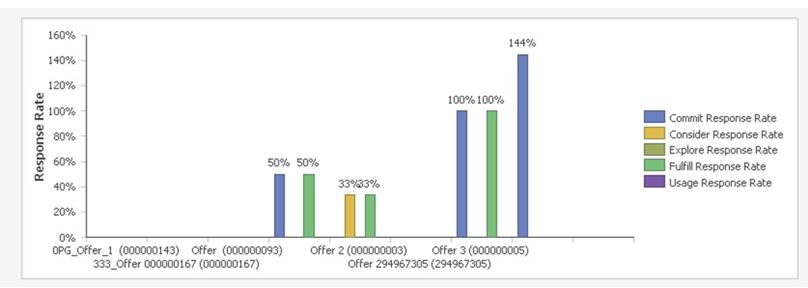
The following example shows a chart that uses the global styles and has additional formatting applied.
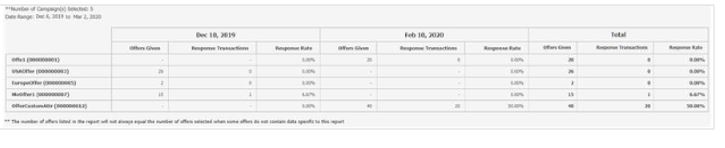
Chart styles
Use the styles included with the global report style sheet, GlobalReportStyles.css, to format charts.
The following table shows formatting from the GlobalStyleSheet.css style sheet for charts:
Charts obtain the following formatting from the GlobalStyleSheet.css.
| Item | Style |
| Charts | 1 pt light gray border |
| Titles and labels | 10 point bold font |
Additionally, when you create a new chart, use the following guidelines to match the existing chart reports.
- Use the default width, unless there is more than one chart on the report. When you include multiple charts in a single report, set the chart width to 750px.
- To use gradients and color palettes, copy and paste the strings from the table in “Global report styles” into the XML report specification.
- As a general guideline, select the chart type based on the data that you expect
to be returned.
- Use line graphs as the chart type only when you can guarantee the report retrieves continuous data.
- If there are multiple series, a stacked bar works better than a non-stacked bar.
- As a best practice, use percentages only when the total percentage equals 100%. Pie charts tend to confuse people when the values do not add up to 100%.
- If there are only two series on a chart and you display both the Y1 and Y2 axes, as a best practice you must match the colors to the first two palette colors for the axis labels.
The following example shows a chart that uses the global styles and has additional formatting applied.
Date formats for English version
If you use a globalized version of the HCL Unica reports package, you see a different date format in your chart reports depending on which locale you use. Unica Insights chart reports use the date style short.
The following table shows the date formats for chart reports for English locale.
Unica Insights chart reports date formats for English version
| Locale | Unica Insights chart reports date format example |
| English | 04/13/2020 |
Dashboard report styles
Dashboard reports use the global styles with some manual formatting.
Use the following guidelines to make sure that reports that are displayed in the Dashboard fit properly in Dashboard portlets.
| Item | Style |
| Background color | Keep background color set to gray (hex value F5F5F5). |
| Size | Specify size by using percentages whenever possible. When sizing with a percentage is not possible, set the size to 323 pixels wide by 175 pixels tall. |
| Subtitles | Put subtitles on the left side. |
| Dates | Put dates on the right side. |
| Legends | Center legends below the chart. |
| Lines in line charts | Display horizontal lines only. Do not display vertical lines. |
| Axis line color | Keep axis lines set to black. |
| Grid line color | Keep grid lines set to gray (hex value c8c8c8). |
| Lists (tables) | Display a maximum of 10 lines. |