Viewing response time breakdown data
In addition to viewing page element and page response time, you can do further analysis to view the response time data for each method.
Before you begin
Procedure
- Open the web analytics reports.
-
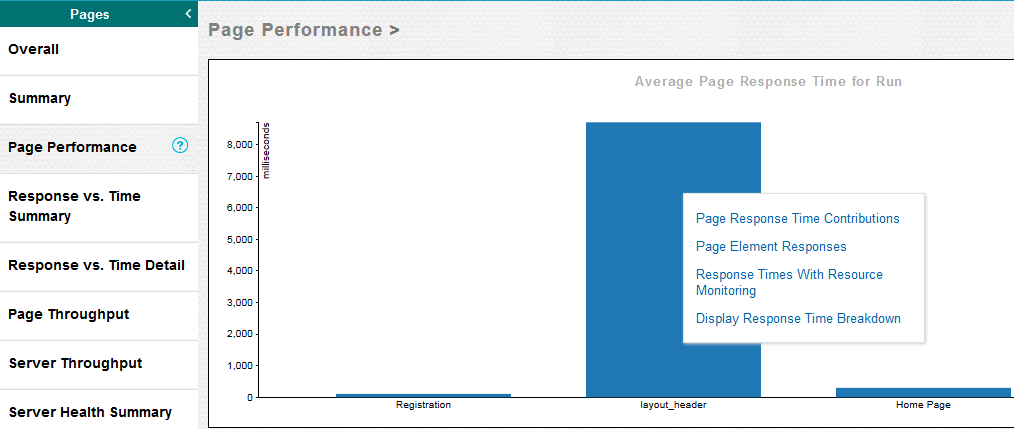
On the Page Performance report, click a page (represented by a bar) and click
Display Response Time Breakdown.
 You can also directly access the response time breakdown data from the Page Element Responses report.
 - In the workbench, the Page Element Selection dialog is open.
- Select a page element to view response time breakdown for and click Finish.