Running HCL OneTest™ API tests
You can use HCL OneTest™ Performance Extension for HCL OneTest™ API to run HCL OneTest™ API tests.
You can install both the products on the same machine, establish the connection, and run HCL OneTest™ API tests. See Testing with HCL OneTest™ API.
You also have the option to just import the projects to HCL OneTest™ Performance HCL OneTest™ API, add the tests to a schedule or compound test to run them. You can either use HCL OneTest™ Performance Agent or HCL OneTest™ API Agent to generate the load. You need a compound test or schedule that contains the HCL OneTest™ API tests.
Setting environment variable
To run the tests with HCL OneTest™ API Agent, set the environment variable INTEGRATION_TESTER_AGENT_HOME and point it to the HCL OneTest™ API Agent installation directory.
INTEGRATION_TESTER_AGENT_HOME = C:\Program Files\HCL\HCLProducts\AgentINTEGRATION_TESTER_AGENT_HOME=/opt/HCL/HOT-API-Agent
export INTEGRATION_TESTER_AGENT_HOME
echo $INTEGRATION_TESTER_AGENT_HOME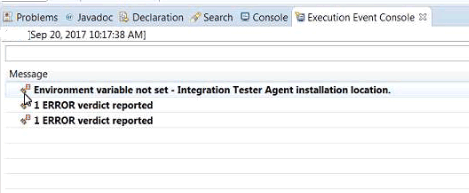
Running the compound test or schedule
- Click Run Compound Test or Run VU Schedule or
Run Rate Schedule.
Note: When you execute the integration tests as part of compound tests, the integration test log is generated and it is available in the Extended Properties section.
Performance Report
The report contains the following pages.
- OVERALL
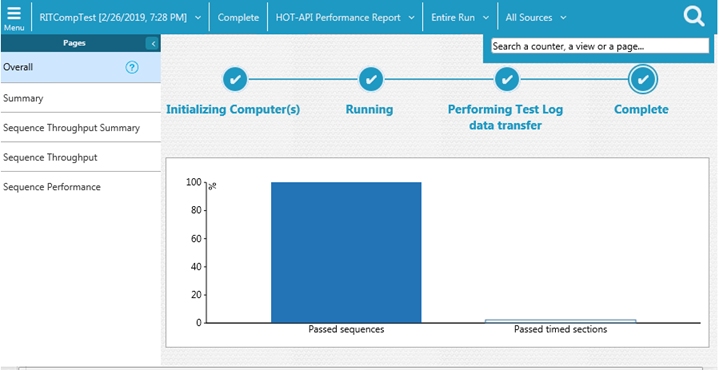
- The Overall page provides this information:
- A progress indicator that shows the state of the run.
- A bar chart on the left shows the overall percentage of passed sequences for the entire run. A sequence corresponds to a test run.
- A bar chart on the right shows the overall percentage of passed timed sections, which are corresponding to individual sections within the steps of the tests.
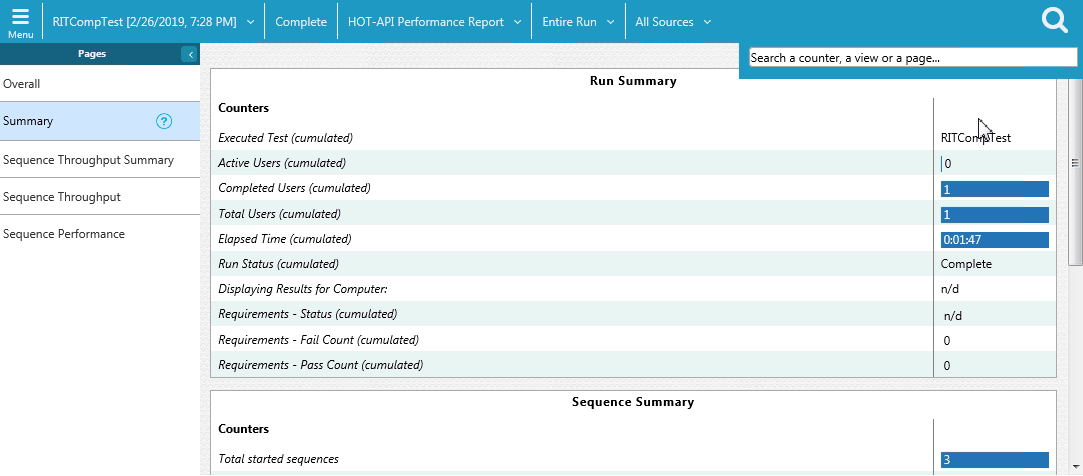
- SUMMARY
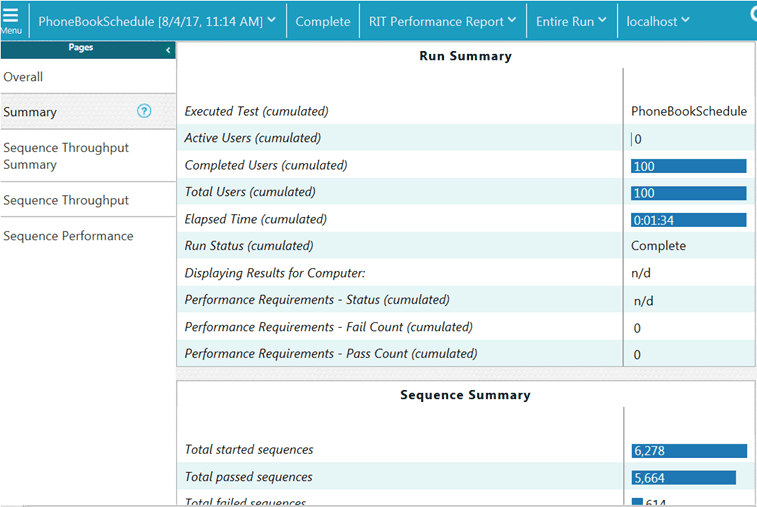
- This page displays information about the run:
- The number of users that are active and the number of users that have completed testing. This number is updated during the run.
- The elapsed time (run duration)
- The status of the run.
- The Performance Requirements: validates the performance requirements that you set in a schedule.
- The summary page also summarizes the data about the sequence run and timed sections: Total
number of sequences that were started and the total number that have been completed, or failed, with
a minimum and maximum rate.
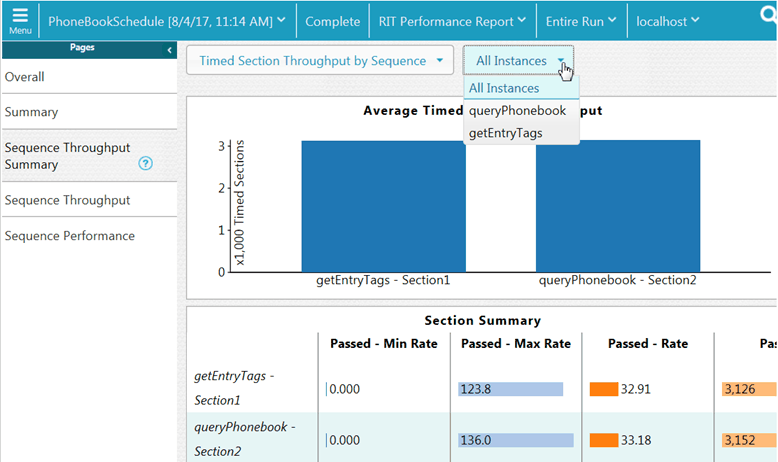
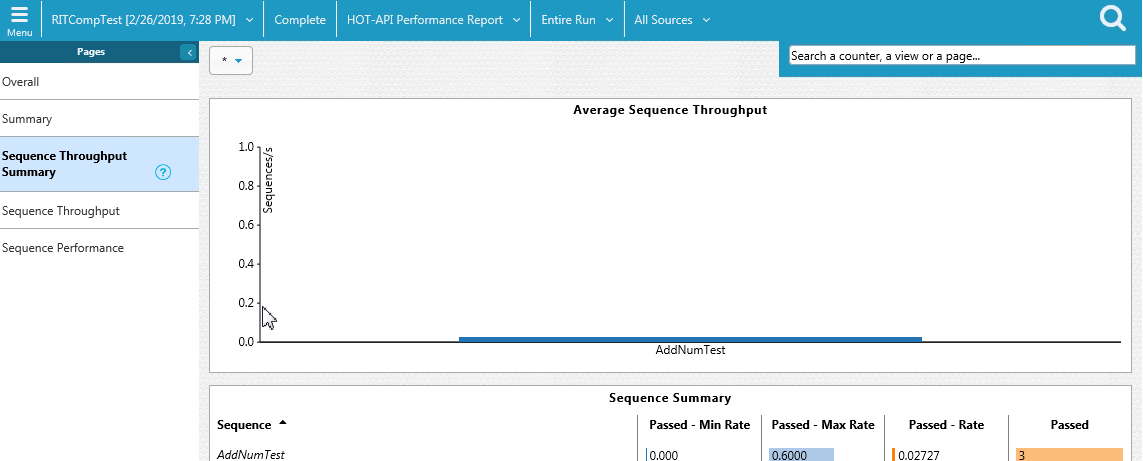
- SEQUENCE THROUGHPUT SUMMARY
- This page shows a bar chart of average throughput in seconds for each sequence.
- And if you add filters, you can see the timed sections throughput for each sequence.
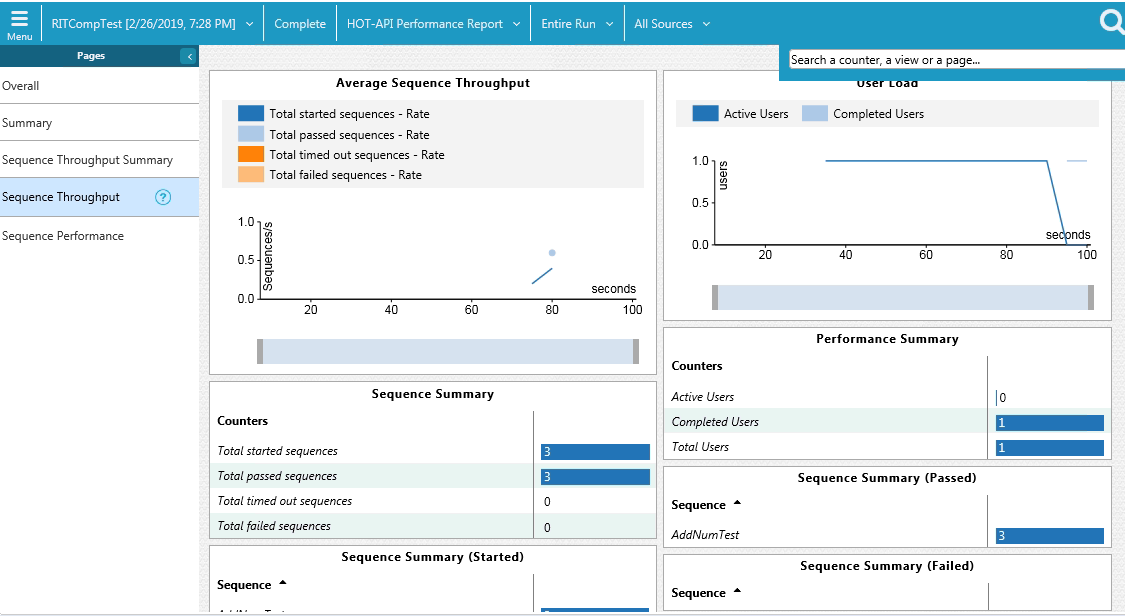
- SEQUENCE THROUGHPUT
- This page shows the average throughput for all combined sequences during the last recorded interval over the time period. Click on one of the Total rate boxed to have one graph displayed at a time or click Select All to see all rates on the same graph.
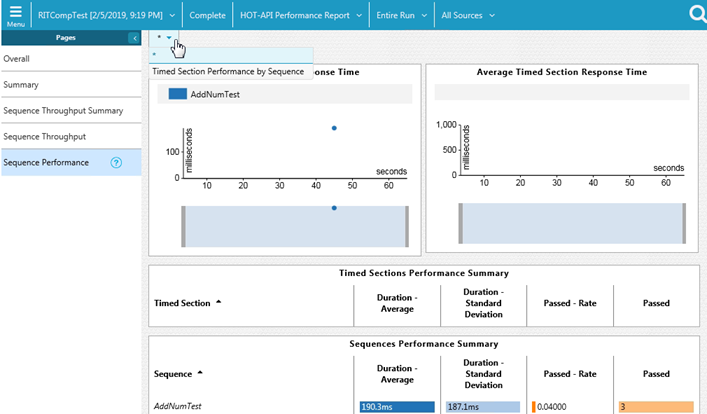
- SEQUENCE PERFORMANCE
- The chart displays the response time of the sequences as the test progresses. You can apply a filter to see the timed sections of all sequences or the timed sections of a particular sequence.
-