Root level file view
Static Metrics for C, C++, Ada
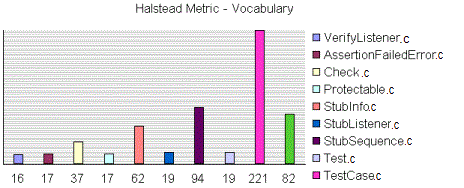
At the top of the Root page, the Metrics Viewer displays a graph based on Halstead data.
On the Root page, the scope of the Metrics Viewer is the entire set of nodes below the Root node.
Halstead Graph

The following display modes are available for the Halstead graph:
-
VocabularySize
-
Volume
-
Difficulty
-
Testing Effort
-
Testing Errors
-
Testing Time
See the Halstead Metrics section for more information.
Metrics Summary
The scope of the metrics report depends on the selection made in the Report Explorer window. This can be a file, one or several classes or any other set of source code components.
Below the Halstead graph, the Root page displays a metrics summary table, which lists for for the source code component of the selected scope:
-
V(g): provides a complexity estimate of the source code component
-
Statements: shows the number of statements within the component
-
Nested Levels: shows the highest nesting level reached in the component
-
Ext Comp Calls: measures the number of calls to methods defined outside of the component class (C++)
-
Ext Var Use: measures the number of uses of attributes defined outside of the component class (C++)
To select the File View:
-
Select File View in the View box of the Report Explorer.
-
Select the Root node in the Report Explorer to open the Root page.
Note With C and Ada source code, File View is the only available view for the Root page.
To change the Halstead Graph on the Root page:
-
From the Metrics menu, select Halstead Graph for Root Page.
-
Select another metric to display.
Related Topics
Root Level Object View | Static Metrics | Viewing Static Metrics