Data Coupling report
From HCL OneTest™ Embedded V8.2.0, you can get a HTML interactive Data Coupling report as a result to your project build.
- Bootstrap,
- JQuery,
- Font Awesome,
- VisJS.
These libraries are not provided. You need an Internet connection when you open the report. Otherwise, download the libraries (.css and .js files), copy them in the same folder as your report's, and modify the template file as follows:
<link rel="stylesheet" href="https://stackpath.bootstrapcdn.com/bootstrap/4.1.3/css/bootstrap.min.css" integrity="sha384-MCw98/SFnGE8fJT3GXwEOngsV7Zt27NXFoaoApmYm81iuXoPkFOJwJ8ERdknLPMO" crossorigin="anonymous">
<link rel="stylesheet" href="https://use.fontawesome.com/releases/v5.5.0/css/all.css" integrity="sha384-B4dIYHKNBt8Bc12p+WXckhzcICo0wtJAoU8YZTY5qE0Id1GSseTk6S+L3BlXeVIU" crossorigin="anonymous">
<link rel="stylesheet" href="https://cdnjs.cloudflare.com/ajax/libs/vis/4.21.0/vis.min.css">
…
<script src="https://code.jquery.com/jquery-3.3.1.slim.min.js" integrity="sha384-q8i/X+965DzO0rT7abK41JStQIAqVgRVzpbzo5smXKp4YfRvH+8abtTE1Pi6jizo" crossorigin="anonymous"></script>
<script src="https://cdnjs.cloudflare.com/ajax/libs/popper.js/1.14.3/umd/popper.min.js" integrity="sha384-ZMP7rVo3mIykV+2+9J3UJ46jBk0WLaUAdn689aCwoqbBJiSnjAK/l8WvCWPIPm49" crossorigin="anonymous"></script>
<script src="https://stackpath.bootstrapcdn.com/bootstrap/4.1.3/js/bootstrap.min.js" integrity="sha384-ChfqqxuZUCnJSK3+MXmPNIyE6ZbWh2IMqE241rYiqJxyMiZ6OW/JmZQ5stwEULTy" crossorigin="anonymous"></script>
<script src="https://cdnjs.cloudflare.com/ajax/libs/vis/4.21.0/vis.js"></script>
<link rel="stylesheet" href="./bootstrap.min.css>
<link rel="stylesheet" href="./all.css">
<link rel="stylesheet" href="./vis.min.css">
…
<script src="./jquery-3.3.1.slim.min.js"></script>
<script src="./popper.min.js"></script>
<script src="./bootstrap.min.js"></script>
<script src="./vis.js"></script
The Report is made of three parts.
- Summary
- In the summary section, a table displays the following information:
- The number of global variables in your application.
- The number of Data Couplings in your application.
- The number and the list of global variables without Data Coupling. If you get this information, it means that HCL OneTest™ Embedded has identified global variables that are read but never written, or written but never read. This could be due to the fact that only a part of the application is analyzed.
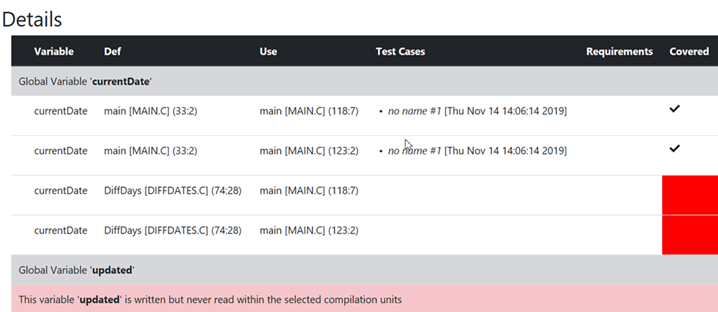
- Details
- A table lists all the Data Couplings and displays the following information for each of them:
-
Variable: The name of the global variable.
- Def: The Def position of the column: file name [line] and (column).
- Use: The Use position of the column: file name [line] and (column).
- Test Cases: The list of cases that covered the Data Coupling.
- Requirements: The list of requirements relative to these test cases.
- Covered: This option is checked if the Data Coupling has been covered.
They are grouped by global variables.
-

- Call graph
- The call graph displays all the global variables with their interactions with one or more
functions of the application that read or/and write them.
- Incoming arrows are 'Def' (write).
- Outcoming arrows are 'Use' (read).
The arrows between them represent a 'Def' or a 'Use' (depending of the sense of the arrow). It is green if the corresponding 'Def' or 'Use' has been covered. These arrows are not representing Data Coupling. A Data Coupling instance is a couple of incoming and outcoming arrows that reach the same global variables.
- Filters
-
Buttons can be used to filter different sections of the report.
- Show/Hide Graph: It is used to show or hide the call graph at the end of the report.
- Show/Hide Requirements: It is used to show or hide the Requirements column in the Details section of the report.
