About coverage reports
The coverage report view displays code coverage information generated by the Code Coverage feature.
- The Source page shows the source code under analysis, highlighted with the actual coverage information.
- The Rates page provides detailed coverage rates for each activated coverage type.
- The Outline view displays the source code components and with an coverage rate bar.
You can use the Outline view to navigate through the report. Click Root to display a global coverage graph, or click a source code component in the Outline to go to the corresponding line on the Source page. Jump directly to the next or previous uncovered portion of source code by using the Next Uncovered Line or Previous Uncovered Line buttons in the toolbar.
Source page
- Green for covered lines of code,
- Red for uncovered lines of code,
- Orange for partially covered lines of code,
- Blue for justified lines of code,
- Blue with the + icon for justified but covered lines of code, which means that they should not be justified.
- Red with - icon for unreachable code.
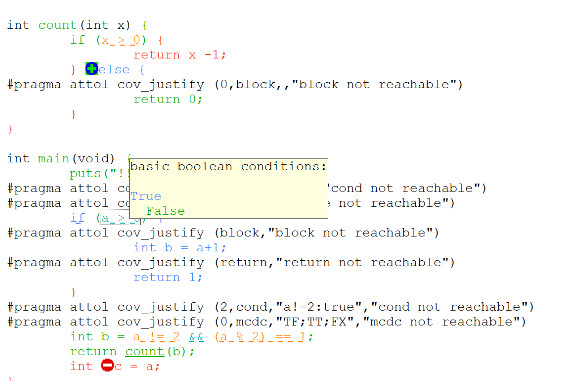
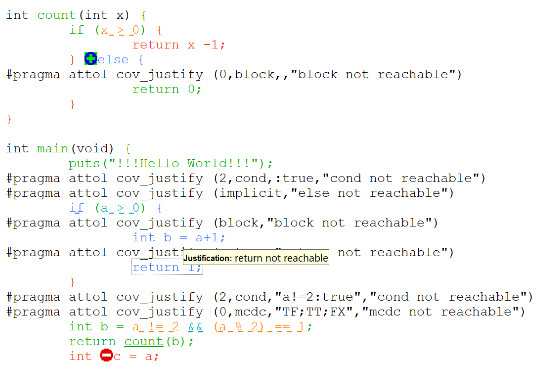
- Click a plain underlined function call to jump to the definition of the function.
- Click a dashed underlined text to view additional coverage information in a pop-up window.
- Right-click any line of code and select Edit Source to open the source file in the source code editor.
- Some macro calls are preceded with a magnifying glass icon. Click the magnifying glass icon to expand the macro in a pop-up window with the usual coverage color codes.
A test-by-test analysis mode allows you to refine the coverage analysis. In test-by-test mode, an Available tests section in the Outline view allows you to select and combine coverage results for different runs. To enable this mode, select Test-by-Test in the toolbar.
The hit count tool displays the number of times that a selected branch was covered. Hit count is only available when test-by-test analysis is disabled and when the hit count option has been enabled for the selected configuration. To enable the hit count tool, right-click the source page and select Hit Count.
The cross reference tool displays the name of tests that executed a selected branch. Cross reference is only available in test-by-test mode. To enable the hit count tool, right-click the source page and select Cross Reference.
Rates page
The Rates page displays a table with the coverage information for each function.
To view the coverage rate and type for a particular component, select the component in the Outline view. Select the Root node to view coverage rates for all current files.
To toggle the displayed format between absolute values, percentages, or both, click on the Display line located just above the table. To sort the table by one of the values, click the column title. Coverage rates are updated dynamically as you navigate through the Outline view and as you select various coverage types.