Memory Profiling Results for C and C++
Memory Profiling for C and C++
After execution of an instrumented application, the Memory Profiling report provides a summary diagram and a detailed report for both byte and memory block usage.
A memory block is a number of bytes allocated with a single malloc instruction. The number of bytes contained in each block is the actual amount of memory allocated by the corresponding allocation instruction.
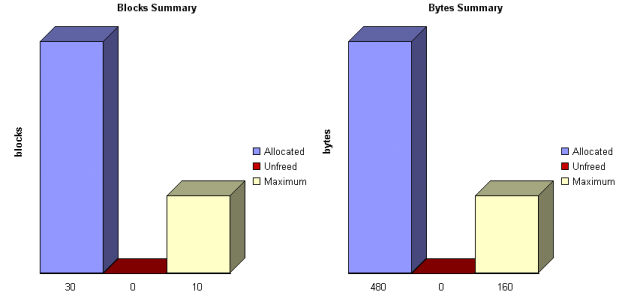
Summary diagrams
The summary diagrams give you a quick overview of memory usage in blocks and bytes.
Where:
-
Allocated is the total memory allocated during the execution of the application
-
Unfreed is the memory that remains allocated after the application was terminated
-
Maximum is the highest memory usage encountered during execution
Detailed Report
The detailed section of the report lists memory usage events, including the following errors and warnings:
Related Topics
Using the Memory Profiling Viewer | Memory Profiling Settings