Coverage source report
Code Coverage applies to Ada, C and C++ languages.
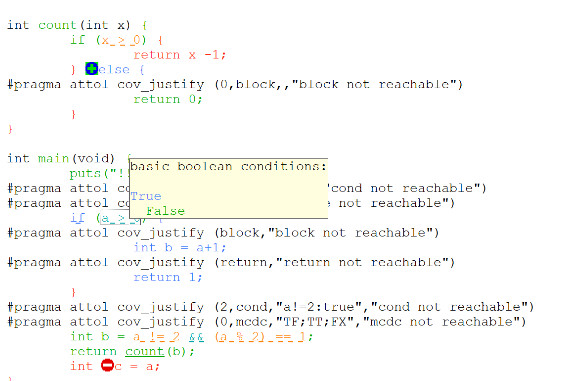
You can use the standards keys (arrow keys, home, end, etc.) to move about and to select the source code. The Code Coverage source report displays covered and uncovered lines of code colors. You can change these colors in the Code Coverage report preferences.
Note: In C source files, the last bracket '}' in a function after a return statement is always displayed as uncovered in the coverage report, even if the function reports 100% coverage.
Code colors
- Green for covered lines of code.
- Red for uncovered lines of code.
- Orange for partially covered lines of code.
- Blue for justified lines of code.
- Blue with the + icon for justified lines of code, which means that they should not be justified.
- Red with - icon for unreachable code.
 For uncovered line of codes that
are justified, click on the blue attributes value to see more details about the
justification text.
For uncovered line of codes that
are justified, click on the blue attributes value to see more details about the
justification text. 
You can change the default colors in the code coverage report preferences. In the main menu toolbar, click , you can modify the text color for the covered lines, covered lines with justify, justified lines, partially covered lines, and uncovered lines.
Hypertext Links
The Source report provides hypertext navigation throughout the source code:
-
Click a plain underlined function call to jump to the definition of the function.
-
Click a dashed underlined text to view additional coverage information in a pop-up window.
-
Right-click any line of code and select Edit Source to open the source file in the Text Editor at the selected line of code.
Macro Expansion
Certain macro-calls are preceded with a magnifying glass icon.
Click the magnifying glass icon to expand the macro in a pop-up window with the usual Code Coverage color codes.
Hit Count
The Hit Count tool-tip is a special capability that displays the number of times that a selected branch was covered.
Hit Count is only available when Test-by-Test analysis is disabled and when the Hit Count option has been enabled for the selected Configuration.
To activate the Hit Count tool-tip:
-
In the Code Coverage Viewer window, select the Source tab.
-
From the Code Coverage menu select Hit. The mouse cursor changes shape.
-
In the Code Coverage Viewer window, click a portion of covered source code to display the Hit Count tool-tip.
Cross Reference
The Cross Reference tool-tip displays the name of tests that executed a selected branch.
Cross Reference is only available in Test-by-Test mode.
To activate the Cross Reference tool-tip:
-
In the Code Coverage Viewer window, select the Source tab.
-
From the Code Coverage menu select Cross Reference. The mouse cursor changes shape.
-
In the Code Coverage Viewer window, click a portion of covered source code to display the Cross Reference tooltip.
Comment
You can add a short comment to the generated Code Coverage report by using the Comment option in the Misc. Options Settings for Code Coverage. This can be useful to distinguish different reports generated with different Configurations.
Comments are displayed as a magnifying glass symbol at the top of the source code report. Click the magnifying glass icon to display the comment.