Working with HCL® Quality Server dashboards
You can filter, search, sort, and choose the number of items to be displayed in HCL® Quality Server dashboards.
Supported operations
| Operation | Environments dashboard | Infrastructure dashboard | Network dashboard |
|---|---|---|---|
| Filter | |||
| Search | |||
| Sort columns | |||
| Choose the number of items for display | |||
| Link to stubs in the Environments dashboard |
Filtering
You can use the check boxes by selecting any or all the filter options to filter the stub and scenario results displayed in the Environments dashboard. The following filter options are available:
| Option | Description |
|---|---|
| Available | This option filters the stubs displayed based on their status as Available in HCL® Quality Server. The stubs that are in the Running state are considered as Available. |
| Unavailable | This option filters the stubs displayed based on their status as Unavailable in HCL® Quality Server. The stubs that are in the Broken, Downscaling, Reconfiguring, Repairing, Starting, Upscaling, or Waiting state are considered as Unavailable. |
| Off | This option filters the stubs displayed based on their status as Off in HCL® Quality Server. The stubs that are in the Stopping or Stopped state are considered as Off. |
Search
You can use the search option in the dashboard to search for any column value. When you click the
Search icon (![]() ), it displays the search box where you must enter the
criteria to search. The search option filters and displays the results that match your search
criteria.
), it displays the search box where you must enter the
criteria to search. The search option filters and displays the results that match your search
criteria.
Sort
You can sort the items in columns in an ascending or descending order by clicking the column header.
Environment pagination
You can use the pagination option in the Environments dashboard to navigate
between pages and change the number of items displayed per page by using the
Pagination box at the end of the page. You can change the number of items
displayed per page to a different value. You can use the Pagination box to
navigate to the First page (![]() ),
Previous page (
),
Previous page (![]() ),
Next page (
),
Next page (![]() ), or the Last page (
), or the Last page (![]() ).
).
Multioperations display
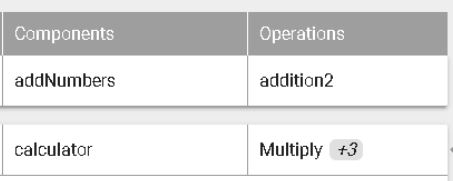
When you hover the cursor over the number in the Operations column, it displays the names of the operations in the tooltip. You can also view the names of the operations by expanding the stub card and clicking the Details tab.
Link to stubs in the Environments dashboard
- Expand the AGENT.
- Expand the Engines tab.
- Click the engine running the stub.
- Click the stub listed in the Stubs field.