Recording SQL events
When the Test Integrations and APIs JDBC proxy is installed, you can use Test Integrations and APIs and Test Virtualization to record SQL events that are executed against databases from applications that use JDBC. There are two methods of selecting a database for recording: Architecture School method and Recording Studio method. Both methods achieve the same result but the Architecture School method is a more direct method.
Before you begin
- Install the Test Integrations and APIs JDBC
proxy. For more information, see Setting up the JDBC proxy. Remember: The version number of the HCL DevOps Test Virtualization Control Panel (Test Virtualization Control Panel) software that you are using must be the same as the version number of the Test Integrations and APIs software that you are using. Therefore, if you upgraded your Test Integrations and APIs installation and you want to record SQL or create database stubs, you must upgrade your server installation and upgrade the JDBC proxy wherever it is deployed.
- In Test Virtualization Control Panel, ensure that the proxy is registered with the server. For more information, see Administration of DevOps Test Virtualization Control Panel.
About this task
(Test Virtualization users can also create, edit, and start/stop database stubs. For information about using Test Virtualization, see DevOps Test Virtualization overview.)
The ability to record SQL events (but not create any database stubs) is useful if you are building test cases in Test Integrations and APIs and want to extract SQL results from queries on a database for analysis or for use in test cases.
You can also record stored procedures. The recorded SQL statements now include SQL Result Sets. For more information on the details that are saved, see Events view.
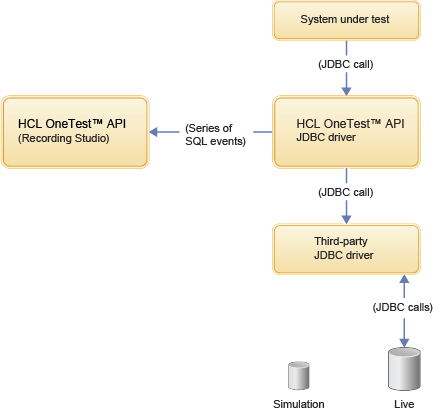
The following diagram illustrates how Test Integrations and APIs records SQL from databases that use JDBC.
Architecture School method
Procedure
- Right-click the logical database that is to be recorded, and click Add event monitor on the menu. Alternatively, select the logical database that is to be recorded, and click Add event monitors for the selected items on the toolbar.
- The Recording Studio opens with the resource listed in the Event Monitor window. To start recording, click Record on the Events View toolbar.
Recording Studio method
Procedure
- Click + on the Event
Monitors toolbar to create an event monitor.
The Select a Resource dialog is displayed.
- On the Select a Resource dialog, click the Show/Hide Recordable Resources button. For more information, see Monitoring operations or transports.
- Select the relevant logical database. Click OK.
- Click Record on the
Events View toolbar.
The Create Stubbed Database Whilst Recording? dialog is displayed.
- Click the No thanks, just record the SQL option button.
- Open the Recording Studio wizard for creating
database stubs.
The first screen of the wizard is displayed.
- Click the Start recording option button.
- Click Finish.
When the application under test makes JDBC SQL calls, they are visible in the Recording Studio Events View window. Click each SQL event to view its details, or to copy the SQL to a test case in Test Integrations and APIs or to another application.