Interpretation of insights
You can find information about interpreting the Machine learning (ML) insights into the supported parameters that are analyzed by HCL DevOps Test Hub (Test Hub) after certain tests are run.
Parameters analyzed through ML
The following parameters in Performance tests or Schedules
are supported for analysis by using ML capabilities in Test Hub:
- The Response Time Lock-Step Pattern parameter.
- The Response Time Standard Deviation Pattern parameter.
- The Throughput Drop Pattern parameter.
Test Hub analyzes the parameters based on certain criteria as detailed in Criteria for analysis of the parameters and then presents its findings as insights about the parameters.
Details of the insights
The insights about the parameters analyzed are displayed in the Insights section on the project Overview page or on the Insights page in a project.
The insights analyzed for the parameters from various tests that were run in the
project are listed in a table. The table lists the following information:
- Name of the test asset in the Test column.
- The parameter analyzed in the Insight column.
- The level of confidence with which the analysis of the parameter was done in the Confidence column. The level of confidence displayed for the analysis can be as Lowest, Low, Medium, High, or Highest. You can view the confidence level as a number when you hover the cursor over the text in the Confidence column.
- The timestamp of the completed analysis in the Identified on column.
- The labels that you added for the specific test run in the Labels column.
- The components in the System Model that are associated with the test asset in the Components column.
You can click the Expand icon ![]() to view the details of the insight.
to view the details of the insight.
You can find information as an example about the following insights that help you to
interpret the insight:
Insights on the Response Time Lock-Step Pattern parameter
When you expand the insight about the Response Time Lock-Step Pattern parameter, you can view the
details displayed similar to the following sample: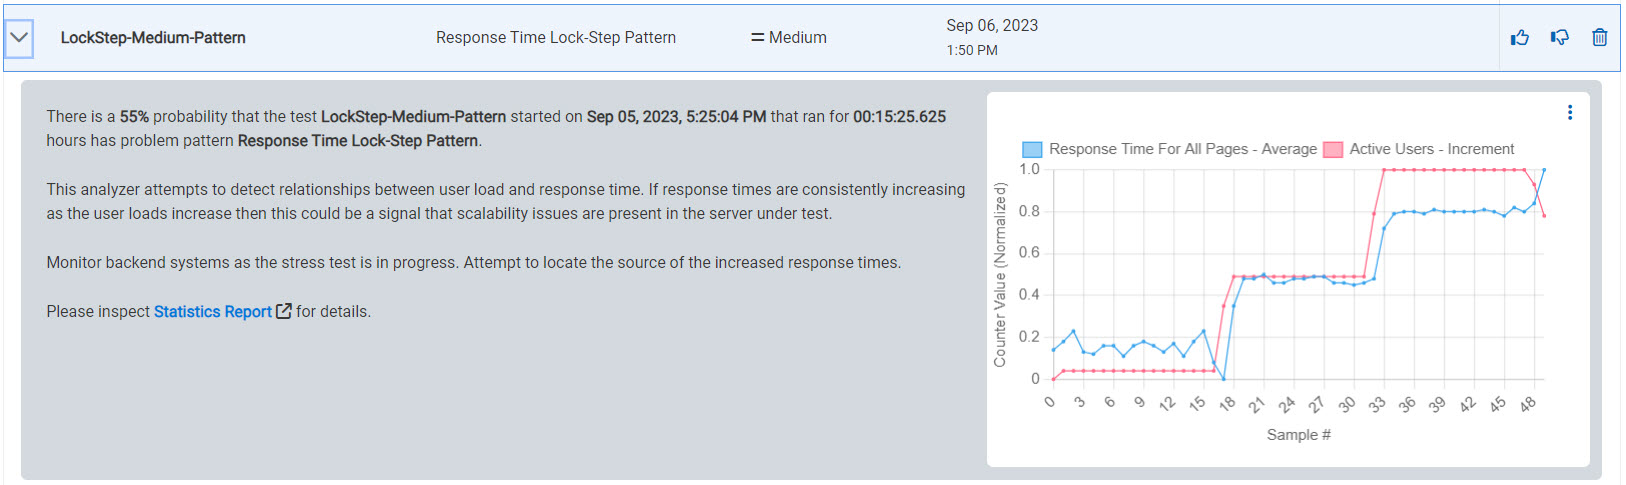
The following information is displayed as insights into the test on analyzing the
Response Time Lock-Step Pattern parameter:
- The probability of finding a problem in the test.
- The description of how the ML analyzer has attempted to analyze the parameter in the test.
- The methods to control the problems are provided as suggestions.
- The graph of the observed data points.
- The link to the Statistics Report generated for the test.
Insights on the Response Time Standard Deviation Pattern parameter
When you expand the insight about the Response Time Standard Deviation
Pattern parameter, you can view the
details displayed similar to the following sample: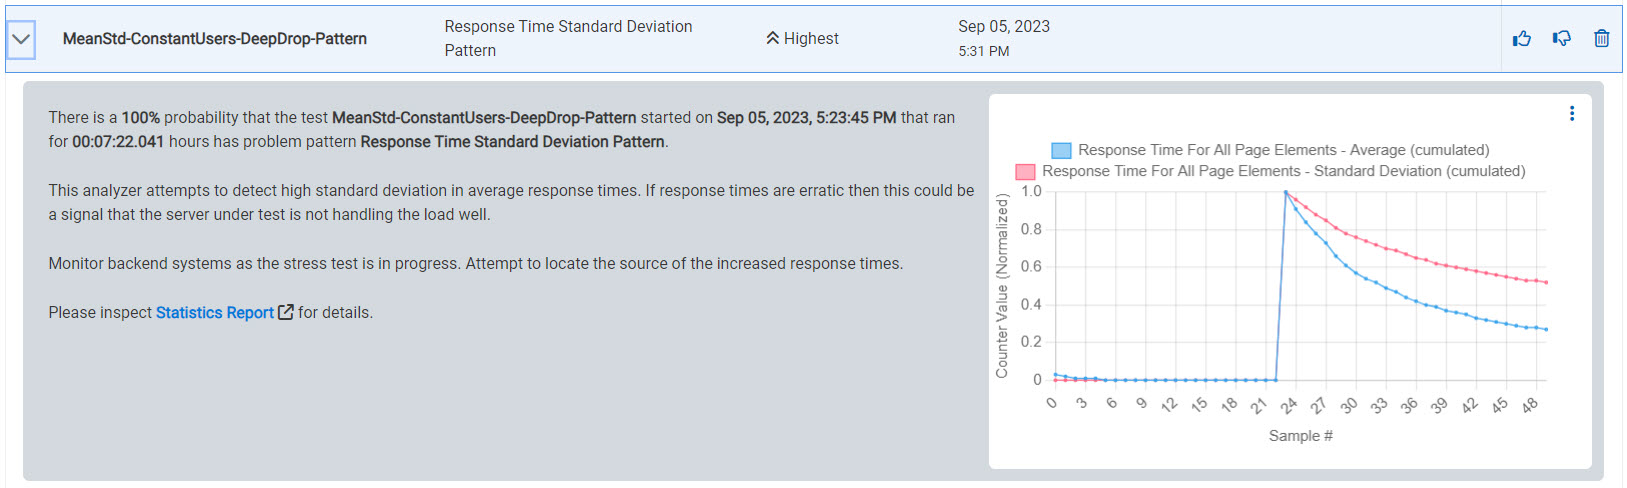
The following information is displayed as insights into the test on analyzing the
Response Time Standard Deviation
Pattern parameter:
- The probability of finding a problem in the test.
- The description of how the ML analyzer has attempted to analyze the parameter in the test.
- The methods to control the problems are provided as suggestions.
- The graph of the observed data points.
- The link to the Statistics Report generated for the test.
Insights on the Throughput Drop Pattern parameter
When you expand the insight about the Throughput Drop Pattern parameter, you can view the
details displayed similar to the following sample: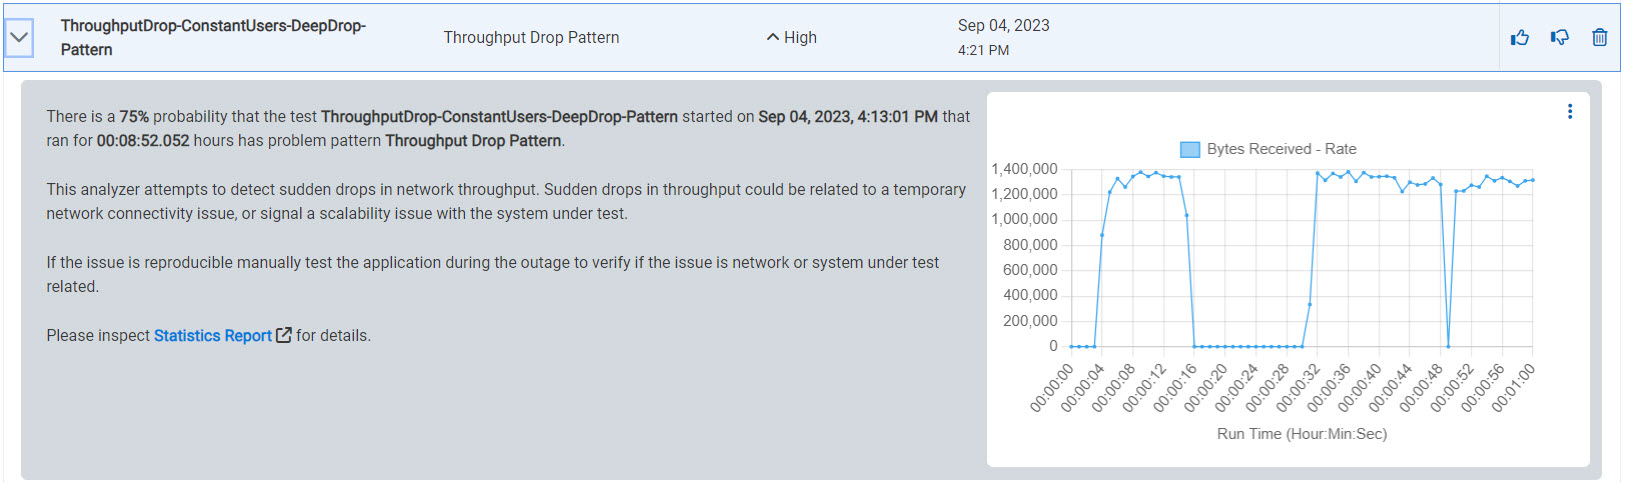
The following information is displayed as insights into the test on analyzing the
Throughput Drop Pattern parameter:
- The probability of finding a problem in the test.
- The description of how the ML analyzer has attempted to analyze the parameter in the test.
- The methods to control the problems are provided as suggestions.
- The graph of the observed data points.
- The link to the Statistics Report generated for the test.