Test results and reports
HCL DevOps Test Hub (Test Hub) is a single location for hosting the results and reports of all tests run on different desktop clients and for tests run from the server.
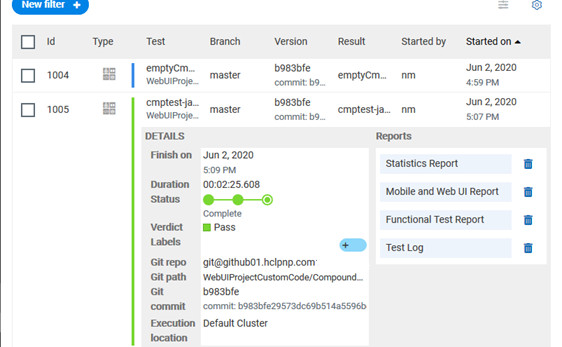
Test results list
When a test run is complete, you can see the results on the Results page that you open from in the navigation pane.
The list of test results is organized by types, you can display the suites only in the Suites tab, or the tests only in the Tests tab, or the tests and suites that are run with advanced settings in the Advanced tab.
Results, reports, and logs are generated for tests run from Test Hub, or from desktop clients such as Test Performance, Test UI, or Test Integrations and APIs.
You must have configured the desktop clients to publish reports of tests that are run from the desktop client to the Test Hub. For more information about the publishing procedure, refer to the links at the end of this page.
- Details
- Reports
- History
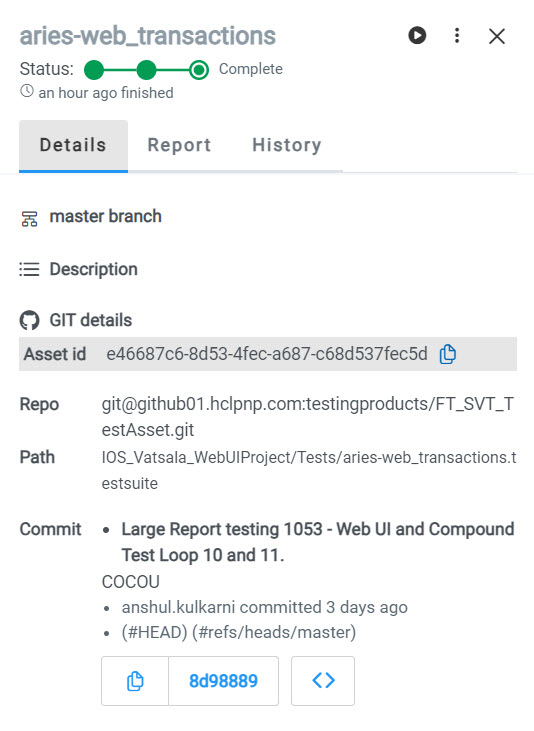
Test result details
- The status of the test results, the date and time it was executed and completed.
- The details about the Git repository that contains the test assets.
You can configure the information displayed in the Details tab
and the Results columns from the View
Settings window. You access this window by clicking the
Settings icon ![]() .
.
Depending on the attribute you cleared in the View Settings window, the Details card displays additional information about the test results.
The selected attributes are displayed in columns of the Result view.
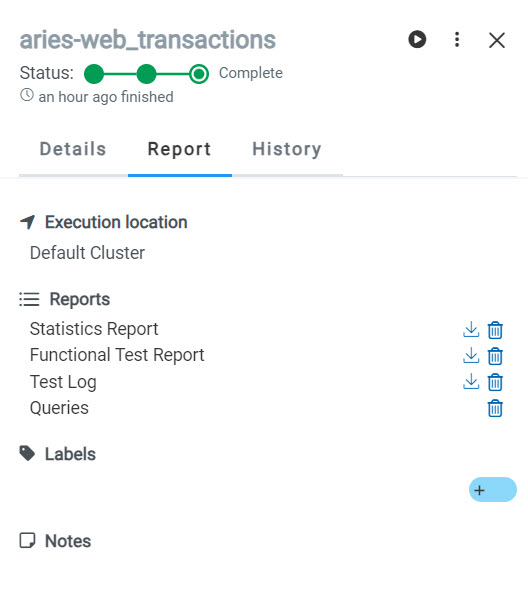
Reports
- The location where the test was run.
- The reports that are generated for the test run.
- The labels that you created for the test during its configuration for a run.
- Notes that you can add to the specific test run result or displays the notes already added by you or others.
- View the report that opens in a web browser by clicking the report.
- Download the report by clicking the Download icon
 . You can enter a name and select the location on your computer
where you want to save the report.The report is downloaded in any of the following formats:
. You can enter a name and select the location on your computer
where you want to save the report.The report is downloaded in any of the following formats:- A compressed file and contains the HTML pages for the supported tests.
- A compressed file that contains the Surefire report.
- A PDF for the supported tests.Note: For tests that contain more than 30 test steps, the details of the test steps are not included in the PDF.
- Delete the report by clicking the Delete icon
 .Note: The deleted report is not available on the server. You might have to run the test again to generate the report.
As a default configuration, test logs are delivered in a traditional format for the executed Compound Tests and schedules.
The reports are generated for Compound Tests, Schedules, and Test Suites, or for other tests that are run from a desktop client or from Test Hub.
The following table lists the reports that are generated for each type of test and the links to help pages.
| Report | Tests type | Product | More information |
|---|---|---|---|
|
Functional Test Report |
API Suite | Test Integrations and APIs | Viewing reports |
| Compound Test | Test UI | Unified Report | |
| AFT Suite | |||
| Functional test (For Web UI tests) | |||
|
Mobile and Web UI Report |
Compound Test |
Test UI and Test Performance | Mobile and web UI test result reports |
| AFT Suite | Test UI | ||
|
Statistics Report |
Compound Test | Test UI and Test Performance |
From the Statistic reports, you can add counters. Refer to Adding additional counters on a separate page.. You can also display the statistics of counters on graphs. Refer to Displaying counter data in tables or as graphs.. |
|
AFT Suite |
Test UI | ||
|
VU Schedule |
Test Performance | ||
| Rate Schedule | |||
| Functional test (For Web UI tests) | |||
| Test Log | Compound Test | Test UI and Test Performance | |
|
AFT Suite |
Test UI | ||
| API Suite | Test Integrations and APIs | ||
|
Functional Test (Web UI) |
Test UI | ||
|
VU Schedule |
Test Performance | ||
| Rate Schedule |