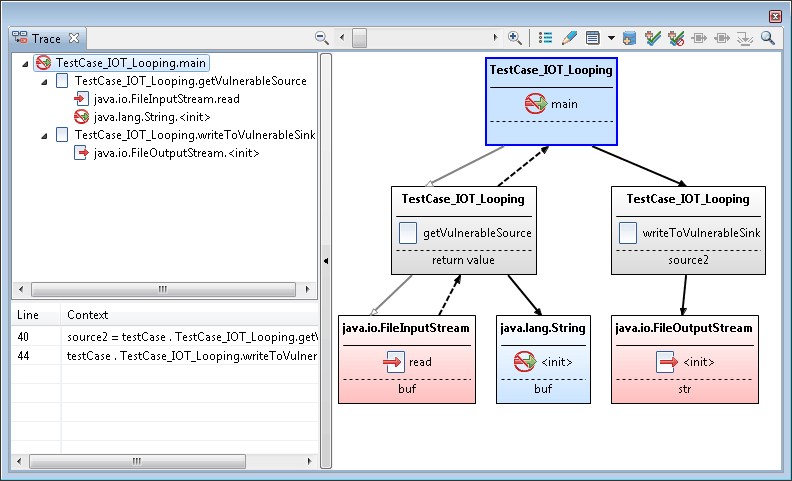
Trace view
AppScan® Source performs input/output analysis and identifies and displays these vulnerabilities. An icon appears in the findings list to identify the row that contains an AppScan® Source trace graph.
In the Trace view, you see the root node, where the input and output stacks meet. The input stack is a series of calls that lead to a source known to provide tainted data. The output stack is a series of calls that lead to a sink. An AppScan® Source trace is generated when the code analyzed can track the use of an unprotected source to an unprotected sink.
- Source: A source is an input to the program, such as a file, servlet request, console input, or socket. For most input sources, the data returned is unbounded in terms of content and length. When an input is unchecked, it is considered tainted. Sources are listed in any findings table in the Source column.
- Sink: A sink can be any external format to which data can be written out. Sink examples include databases, files, console output, and sockets. Writing data to a sink without checking it may indicate a serious security vulnerability.
- Lost Sink A lost sink is an API method that can no longer be traced.
This diagram illustrates the call sequence from the root through the input stack and the output stack.

In the diagram:
- Unfilled arrows show a call that does not have a known tainted data flow.
- Filled arrows have potentially tainted data. Dashed lines show a return path.
- Solid® lines represent a method call.
Tip:
- In the Trace view, hovering over trace nodes in the graph provides information about the node.
- The two left panels in the view (the input/output stacks panel and the data flow panel) can be collapsed for easier viewing of the graphical call graph. To collapse these panels, select the Hide tree view arrow button. To display these panels when they are hidden, select the Show tree view arrow button.
- Move the scroll bar to zoom in and focus on details - or to zoom out to see more. Hovering over the zoom scroll bar provides the current zoom level. To zoom in to the maximum level, click Zoom to 200%. To zoom out as far as possible, click Zoom to fit.