JavaScript Statement Graph
The statement graph section of a JavaScript™ trace displays the data flow between statements.
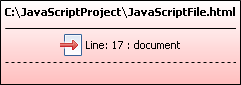
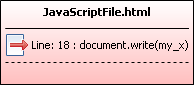
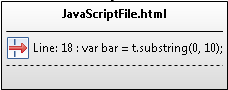
Within the graph, each statement is a rectangle that provides the following information:
- The path and file name of the affected file. If the next statement is located in the same file, only the file name is listed.
- The line number that contains the statement.
- If available, the section of code that is of interest.
- If the rectangle is red, the statement is a source, sink, or both.
- If the rectangle is grey, the statement is a taint propagator.
- Hover text for the statement provides greater detail.
Lines with arrows represent data flowing from statement to statement.
| Symbol | Description |
|---|---|
 |
Flow of tainted data |
 |
Source (red): A statement that is the origin of potentially untrustworthy data. |
 |
Sink (red): A statement that is potentially vulnerable to tainted data or is potentially dangerous to use. |
 |
Taint propagator: A statement that propagates taint to one or more of its parameters, to its return value, or to this pointer. |
Tip:
- In the Trace view, hovering over trace nodes in the graph provides information about the node.
- The two left panels in the view (the input/output stacks panel and the data flow panel) can be collapsed for easier viewing of the graphical call graph. To collapse these panels, select the Hide tree view arrow button. To display these panels when they are hidden, select the Show tree view arrow button.
- Move the scroll bar to zoom in and focus on details - or to zoom out to see more. Hovering over the zoom scroll bar provides the current zoom level. To zoom in to the maximum level, click Zoom to 200%. To zoom out as far as possible, click Zoom to fit.