Test Automation in AppScan® Enterprise using AppScan Traffic Recorder
The AppScan Traffic Recorder enables you to record traffic to use as Explore data in your AppScan Enterprise (ASE) job. The AppScan Traffic Recorder is a system for managing traffic recorder instances. Traffic recorder instances can be created on demand to record traffic that will later be used for a DAST scan. This document describes how to set up and use the traffic recorder.
Overview
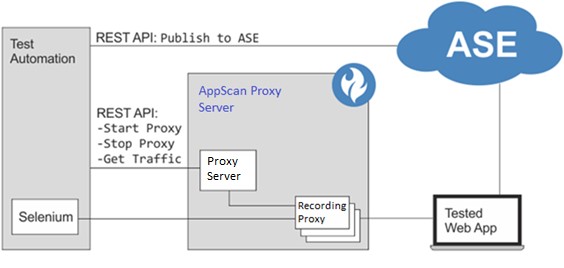
- Using the AppScan Traffic Recorder, you can automatically start a traffic recorder instance. The requests from the automation framework to the web app are then recorded as they are sent through the Traffic Recorder. The traffic is saved in HAR format in a .dast.config file, that you can later upload to be used by AppScan Enterprise (ASE) as Explore data for a scan.
- You can also record traffic manually, through the Traffic Recorder, to create a .dast.config file.
- You can also upload your own HAR file directly to ASE, without using the Traffic Recorder.
This diagram depicts the automated scan flow with AppScan® Enterprise.
Typical Workflow
- Install Traffic Recorder
- Configure Traffic Recorder
- Start Traffic Recorder
- Using the Traffic Recorder
Install the AppScan Traffic Recorder
- Download one of the current versions of Node.js (v14.14 or later) and install it on your machine. If your service is FIPS compliant, you must use a FIPS compliant Node.js server.
- Unzip TrafficRecorder.Windows.zip to a folder on your machine.
- To overwrite a default port for the Traffic Recorder to run on: Configure the port setting in Settings.json.
Configure the AppScan Traffic Recorder
FIPS compliant mode
- Locate the file Settings.json in the root folder of the Traffic Recorder and open it in a text editor.
- Locate the setting requireFips and change its value from false to true.
- Save the file.
Traffic Recorder connection
- To set a default port for the Traffic Recorder to run on: Configure the port setting in Settings.json.
- For a secure (SSL) connection to the Traffic Recorder: Configure your own PEM or PKCS12
certificate in Settings.json.
- A PEM certificate requires two files (full paths) and a PKCS12 certificate requires one file (full path) and a password.
- Do not forget to escape characters as needed both in file paths and password, for
instance a password such as abc!”123 would become abc!\”123 (the “ is
escaped).
Example using openssl to create a PEM certificate:
openssl req -newkey rsa:2048 -new -nodes -keyout key.pem -out csr.pem
openssl x509 -req -days 365 -in csr.pem -signkey key.pem -out server.crt
Example using openssl to convert the PEM certificate to PKCS12 certificate:
openssl pkcs12 -export -out certificate.pfx -inkey key.pem -in server.crt
Example using Java’s keygen tool to convert a JKS certificate to PKCS12 certificate:
keytool -importkeystore -srckeystore certificate.jks -srcstoretype JKS -destkeystore certificate.p12 -deststoretype PKCS12
Root Certificate
If the application you are testing uses SSL (HTTPS), the AppScan Traffic Recorder must act as a man-in-the-middle to record traffic. To do this it must have a root certificate that it can use to sign its communication with the app.
- Install the certificate generated by the AppScan Traffic Recorder on your machine(s):
- Use the REST API to download the self-signed Root Certificate Authority, used by the AppScan Traffic Recorder, as a PEM file.
- Install it on the browser used for the Explore, or wherever needed (depending on where the traffic is sent from).
- Import your own root certificate to the AppScan Traffic Recorder. Supported certificate formats are
PKCS12 (.P12, .PFX), JKS:
- Open a command line window and navigate to the installation folder on the Traffic Recorder machine.
- Run the following command:
.\Java\jre\bin\java -jar DastProxy.jar -irc [path to certificate file] -ircp [password]
Note: To see the complete command usage, run the .\Java\jre\bin\java -jar DastProxy.jar command.Important: Since the certificate will be saved on the Traffic Recorder, it is recommended that you use a dedicated test certificate.
- Provide your own fixed server certificate (not a root certificate) in the StartProxy command.
Set Inactivity Timeout
If a traffic recorder instance is not closed with a close command after use, it remains open and listening on the port. Traffic recorder instances are closed automatically if they are idle for a predefined time.
The default inactivity timeout for traffic recorder instances is 60 minutes. You can change this value by changing the value of inactivityTimeoutInMinutes in the Settings.json file saved in the installation folder.
Encrypt Traffic
By default, the traffic (.dast.config) file is not encrypted. To configure the server to encrypt all traffic, change the "encryptDastConfig" value to “true” in the Settings.json file, found in the installation folder.
Chained Proxy
If you need to define more than one chained proxy, or exceptions to the proxy, use the chained proxy rules file (proxy.chain) found in the installation folder. The file includes instructions for use.
Start/Stop the Traffic Recorder
You can simply start the Traffic Recorder, or run it as a service (below). Note that you can’t do both in parallel.
- Run the command: node app.js [port]
where, *port = the port on which the Traffic Recorder listens for REST API requests.
- If you do not define the port when starting the Traffic Recorder, the port set in the Settings.json file is used, if none is defined there, port 8383 is used.
- There is no need to stop the Traffic Recorder, you can leave it running permanently.
Start as a Windows Service
To start the service, run the commands:
node service.js --install
node service.js --start
Additional Service Commands
You can print this list by running the command node service.js --help
| Service commands | Description |
|---|---|
| --start | Start the service |
| --stop | Stop the service |
| --install | Install the service |
| --uninstall | Stop and uninstall the service |
| --h | --help | Output usage information |
Stop the Windows Service
To stop the Traffic Recorder Windows Service by using the service.js executable found in the ‘Service’ folder, run the command:
node service.js --uninstall
Start as a Linux Service using systemD
- Create a new file under systemD directory (usually: /etc/systemd/system).
For example, sudo vim
/etc/systemd/system/TrafficRecorder.service. File
content:
[Unit]
Description=Appscan TrafficRecorder
After=multi-user.target[Service]
ExecStart=[path to node here] [path to app.js here]Restart=always
RestartSec=10StandardOutput=syslogStandardError=syslog
SyslogIdentifier=TrafficRecorder[Install]
WantedBy=multi-user.target
Example for ExecStart: ExecStart= node /home/admin/Documents/TrafficRecorder.Linux.1.2.0/app.js
- Ensure app.js and internal java file: /java/bin/java have “run as executable” permissions.
- Reload systemD files by using the command: sudo systemctl daemon-reload
- Start the service by using the command: sudo systemctl start TrafficRecorder.service
- You can check status by using the command: sudo systemctl status
TrafficRecorder.service
Note: Status should show as “Active: active (running)”
- Enable the service by using the command: sudo systemctl enable TrafficRecorder.service
Stop the Linux Service
- Stop the service by using the command: sudo systemctl stop TrafficRecorder.service
- Disable the service by using the command: sudo systemctl disable TrafficRecorder.service
Using the Traffic Recorder
Once the Traffic Recorder has started, you can start new traffic recorder instances, to record the traffic of your application.
- To start a traffic recorder instance, use the REST API request: StartProxy
- Send your traffic to the application you are testing, via the defined traffic recorder port.
- When done, send the REST API request: StopProxy.
- Download the .dast.config file, which contains the recorded traffic, by sending REST API request: Traffic. The file is a ZIP file containing one or more .har (HTTP Archive) files. When you download this file, the data is deleted from the AppScan Traffic Recorder.
- You can use the .dast.config file to update the Explore data of an existing job, using the ASE REST API. See the documentation link: https://<domain>:9443/ase/api/pages/apidocs.html. For more information, see Traffic Recorder API commands section.
Traffic Recorder API commands
Once the Traffic Recorder has started, you can start a traffic recorder instance, and send your traffic to your application.
Documentation
To view the complete REST API documentation in Swagger, type in a browser: http(s)://<server>:<port>
All commands point to an endpoint that looks like this:
http(s)://[server]:[port]/automation/
server = IP address of the machine on which the Traffic Recorder is installed (default is localhost)
port = port on which the Traffic Recorder listens
"StartProxy"
- URL: http://[server]:[port]/automation/StartProxy/<recordingPort>
- Request type: POST or GET (if using chainedProxy, proxyCertificate, and clientCertificate the request is POST; otherwise it is GET)
"StopProxy"
- URL: http://[server]:[port]/automation/StopProxy/<recordingPort>
- Request type: GET
"StopAllProxies"
Stop all running traffic recorder instances. This command stops all traffic recorder instances on all ports, including those started by other users.
- URL: http://[server]:[port]/automation/StopAllProxies
- Request type: POST
"EncryptDastConfig"
- URL: http://[server]:[port]/automation/EncryptDastConfig
- Request type: POST
"DownloadEncryptedDast"
- URL: http://[server]:[port]/automation/DownloadEncryptedDastConfig/<uuid>
- Request type: GET
"Traffic"
- URL: http://[server]:[port]/automation/Traffic/<recordingPort>
- Request type: GET
"Certificate"
- URL: http://[server]:[port]/automation/Certificate
- Request type: GET